
A couple of weeks ago, I ported my game You Are Circle to the browser using Emscripten. Using the conan EMSDK toolchain, this was surprisingly easy to do. The largest engineering effort went into turning the “procedurally generate the level” background thread into a coroutine that I could execute in the main thread while showing the loading screen, since threads are not super well supported (and require enabling a beta feature on itch.io). I already had a renderer abstraction targeting OpenGL 4.1, which is roughly on feature parity with OpenGL ES 3.0, which is what you see WebGL2 as from Emscripten. And that just worked out of the box and things were fine for a while. Until they weren’t.
60FPS to 2FPS
Last week I finally released a new feature: breakable rocks. These are attached to the level walls and can be destroyed for power-ups. I tested this on my machine and everything seemed to be working fine. But some people soon started complaining about unplayable performance in the web build, in the range of 1-2 FPS, coming from a smooth 60 FPS on the same machine. So I took out my laptop and tested it there, and lo and behold, it was very slow indeed. On chrome, even the background music was stuttering. I did some other ‘optimization’ work in that patch, but after ruling that out as the culprit via bisection, I quickly narrowed it down to the rendering of the new breakable rocks.
The rocks are circled in red in this screenshot:
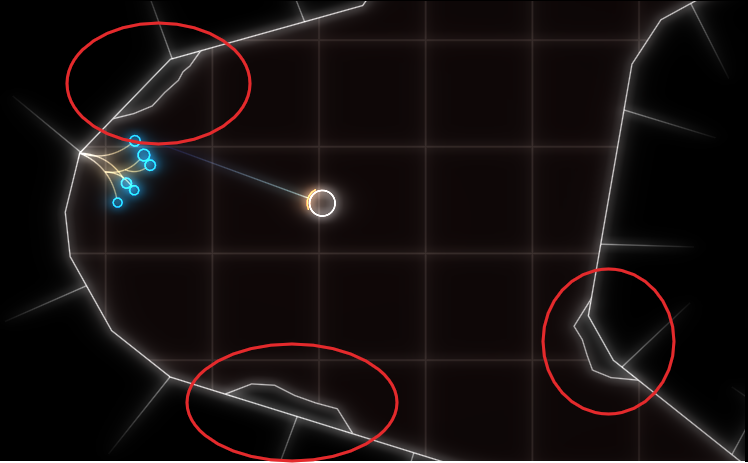
As you can see, everything is very low-poly. The rocks are rendered in two parts, a black background hiding the normal level background and the white outline. If I removed the background rendering, everything was fine (except for the ‘transparent’ rocks).
Now it’s important to know that the rendering is all but optimized at this point. I often use the most basic thing given my infrastructure that I can get away with until I see a problem. In this case, I have some thingies internally that let me draw in a pretty immediate mode way: Just upload the geometry to the GPU and render it. Every frame. At the moment, I do this with almost all the geometry, visible or not, every frame. That was fast enough, and makes it trivial to change what’s being rendered when the rock is broken. The white outline is actually more geometry generated by my line mesher than the rock-background. But that was not causing any catastrophic slow-downs, while the background was. So what was the difference? The line geometry was batched on the CPU, while I was issuing a separate draw-call for each of those rocks. To give some numbers: there were about 100 of those rocks, with each of with up to 11 triangles.
Suspecting the draw call overhead, I tried batching, e.g. merging, all the rock geometry into a single mesh and rendering it with a single draw call. That seemed to work well enough. And that is the version currently released.
Deep Dive
But the problem kept nagging at me after I released the fix. Yes, draw calls can have a lot of overhead, especially in Emscripten. But going from 60FPS to 2FPS still seemed pretty steep, and I did not fully understand why it was so extremely bad. After trying Firefox’s Gecko Profiler, which was recommended in the Emscripten docs, I finally got an idea what was causing the problem. The graphics thread was indeed very busy, and showing a lot of time in MaxForRange<>. That profiler is actually pretty cool, and you can jump directly into the Firefox source code from there to get an idea what’s going on.
Geometry is often specified via one level of indirection: The actual ‘per Point’- a.k.a. Vertex-Array and a list of indices pointing into that, with each triplet defining a triangle. This is a form of compression, and can also help the CPU avoid duplicate work by caching. But it also means that the indices can be invalid, e.g. there can be out-of-bounds indices. And browsers cannot allow that fore safety reasons, so they check the validity before actually issuing a rendering command on the GPU. MaxForRange<> is part of the machinery to do just that via its caller GetIndexedFetchMaxVert. It determines the max index of a section of an index buffer. When issuing a draw call, that max-index is checked against the size of the per-point-data to avoid out-of-range accesses.
This employs a caching scheme: For a given range in the indices, the result is cached, so it doesn’t have to be evaluated again for repeated calls on the same buffer. Also, I suspect to make this cache ‘hit’ more often, the max-index is first retrieved for the whole of the current index buffer, and only if that cannot guarantee valid access, is the subrange even checked. See the calls to GetIndexedFetchMaxVert in WebGLContext::DrawElementsInstanced. When something in the index list is changed from the user side, this cache is completely evicted.
The way that I stream my geometry data in my renderer is by using “big” (=4mb) per-frame buffers for vertex and index data that I gradually fill in some kind of emulated “immediate mode”. In the specific instance for the rocks, this looks like this:
for (auto& each : rock){ auto vertex_source = per_frame_buffer.transfer_vertex_data(each.vertex_data); auto index_source = per_frame_buffer.transfer_index_data(each.index_data); device.draw(vertex_source, index_source, ...);}
The combination of all that turned out to be deadly for performance, and again shows why caching is one of the two hard things in IT. The code essentially becomes:
for (auto& each : rock){ auto vertex_source = per_frame_buffer.transfer_vertex_data(each.vertex_data); invalidate_per_frame_index_buffer_cache(); auto index_source = per_frame_buffer.transfer_index_data(each.index_data); fill_cache_again_for_the_whole_big_index_buffer(); device.draw(vertex_source, index_source, ...);}
So for my 100 or so small rocks, the whole loop went through about 400mb of extra data per frame, or ~24gb per second. That’s quite something.
That also explains why merging the geometry helped, as it drastically reduced the amount of cache invalidations/refills. But now that the problem was understood, another option became apparent. Reorder the streamed buffer updates and draw calls, so that all the updates happen before all the draw calls.
Open questions
I am still not sure what the optimal way to stream geometry in WebGL is, but I suspect reordering the updates/draws and keeping the index buffer as small as possible might prove useful. So if you have any proven idea, I’d love to hear it.
I am also not entirely sure why I did not notice this catastrophic slow-down on my developer machine. I suspect it’s just because my CPU has big L2 and L3 caches that made the extra index scans very fast. I suspect I will see the performance problem in the profiler.
