Rails partials are a great way to reuse view code, but they have traditionally suffered from one weakness: their interface is implicit.
When opening a partial written by another developer, it is often unclear which locals are required, which are optional, and whether all of them are still used. IDEs typically cannot help much either, often showing warnings about unresolved variables because they cannot determine where the values come from.
The problem becomes even more apparent as an application grows and partials are rendered from multiple places.
If a local is forgotten by call, the error only appears when the template is rendered:
undefined local variable or method `missing_local'
If an extra local is passed, Rails traditionally ignores it.
Over time this creates a situation where the real API of the partial exists only in the heads of the developers maintaining it.
Rails Strict Locals
Rails provides a feature called strict locals that allows a partial to declare its expected interface:
<%# locals: (title:, highlight: false) %>
The declaration resembles Ruby keyword arguments and is placed at the top of the template.
A local like title without a default value is required. Locals like highlight with default values become optional
The partial now documents and enforce its own API. If a required local is missing, Rails raises an exception instead of failing later when the variable is accessed. Likewise, if a caller provides a local that is not declared, Rails rejects it.
Conclusion
Strict locals do not fundamentally change how partials work, but they make them easier to understand and maintain.
By declaring the expected locals directly in the template, partials become self-documenting and gain an explicit contract with their callers. Missing locals are detected early, obsolete locals are rejected, and developers no longer have to search through controllers, parent templates, and render calls to understand where variables come from.
An additional benefit is improved tooling support. Once the interface of a partial is explicit, IDEs can understand the available variables much better. Your IDE becomes a helpful companion again rather than a source of noise.
entt will automatically call into on_construct and on_destroy.
People nowadays usually avoid linked lists because of all the pointer chasing required to actually use them. The pointer chasing is not the problem though, the non-locality is. If you make sure your nodes are all allocated in memory close to each other, there is hardly a penalty. entt will usually do this if nodes are also allocated close in time, which is often the case if you want to group things, so this works nicely in that regard, too. Feel free to use this code under CC0.
Every developer has personal formatting preferences. Brace placement, line wrapping, imports, tabs vs. spaces — everybody has an opinion, and most of them are reasonable.
The problem starts when all these styles meet in one repository.
The cost of “personal style”
A codebase written by ten developers can easily look like ten different applications stitched together. Suddenly, pull requests are full of formatting changes. Git diffs become noisy. Merge conflicts appear because one developer reformatted a file differently than another. Code reviews drift into discussions about whitespaces instead of actual functionality.
Even worse: inconsistent code slows down reading.
Humans recognize patterns quickly. When code follows the same visual structure everywhere, the brain spends less effort parsing syntax and more effort understanding intent.
Consistent formatting reduces cognitive load.
A shared style is less about aesthetics and more about reducing friction. But how to solve this problem?
Shared Project Style
In IDEs like IntelliJ, you can define a code style and automatically reformat code according to those rules. This helps you keep your own code consistent. However, if every developer uses a different style, it does not help the project as a whole.
You can configure the style under:
Settings -> Editor -> Code Style
and save it as a project-level configuration. IntelliJ will then create a codeStyles folder with XML files inside the .idea directory.
The solution for sharing one configuration across the whole project is to commit these files to Git. This way, every developer working on the project uses the same code style configuration.
The IDE can then help enforce the agreed style by reformatting code before commit or even automatically on save.
Consistency beats preference
The important thing is not finding the perfect style. The important thing is agreeing on one.
A consistent codebase is easier to read, easier to review, and easier to maintain. Pull requests become smaller and cleaner because they contain actual changes instead of formatting noise.
Good formatting should be boring and automatic. That leaves more time for discussions that actually matter.
Debating about pros and cons of different code styles quickly tend to enter “which color is best”-territory, so this is not what I’ll do here, but consider the following an internal debate of mine that occurs from time to time.
The “Structure” of a piece of code spans various topics: from syntactical preferences like conventions for curly braces, to case conventions, naming variables, indentation, line breaks and whitespace in general, how to distribute methods between classes, between files, up to its high-level architecture. I am strictly not talking about the higher levels here.
However, in the finer levels of your code, you will apply a mixture of conventional choices coming from the programming language, the culture surrounding it, and your own background. Some will be shaped by your IDE. Keep in mind that all choices are to be done to aim for one goal:
To produce readable code which is straightforward to argue about.
“Readable” is a heavy word as it bears the inseparability of both (a) prerequisites the reader has to fulfill (who are they and why are they even reading my code?) and (b) that getting used to one convention can greatly affect the reading speed more than any in-grained perks of that convention, but nevertheless, there does exist a dimension outside that.
There is some remaining variability in choice, for example, in how to continue the intendation in a multi-line argument list, how to place newlines in chained calls like fluent interfaces / LINQ in .NET / Promises in JS / … or in chained conditionals – the list goes on.
But for example; what is the optimum, e.g. in this Python example
if (self.evaluate_user_input()
and user_role is in (UserRole.Admin, UserRole.ProjectOwner)):
do_stuff()
# vs
if (self.evaluate_user_input() and
user_role is in (UserRole.Admin, UserRole.ProjectOwner)
):
do_stuff()
# vs
if (self.evaluate_user_input()
and user_role is in (UserRole.Admin, UserRole.ProjectOwner)):
do_stuff()
# vs
if (self.evaluate_user_input()
and user_role is in (
UserRole.Admin,
UserRole.ProjectOwner
)):
do_stuff()
# vs ... outsourcing any of that logic into its own place,
# but even that comes with risks of cluttering structure elsewhere.
Another example are braces in any language that uses them, because I’ve encountered a couple of scenarios where the convention would suggest…
if (theThing) {
quiteALot();
ofDifferent();
lines();
} else {
nowSomeCompletely();
differentStuffToDo();
}
# breaking the brace convention, just for that "else",
# conveys a lot purpose to distinguish these branches. for me.
if (theThing) {
quiteALot();
ofDifferent();
lines();
}
else {
nowSomeCompletely();
differentStuffToDo();
}
Line breaks and continuation can be crucial because they influence how far the eyes have to extend to the right (maybe requiring horizontal scrolling, which is a dealbreaker in any measure of quickly-understanding), but whitespace can be beneficial in distinguishing your product from a pile of unicode vomit (which is why gofmt is wrong in believing that inline formulae are always better with any spaces distilled out).
The more I think about it, the less I would agree with anyone convinced that one should just strife towards one certain style and then stick to it. Moreover, the actual content of a line of code can dominate the decision at hand more than a well-meaning thought of “all of these decisions are equal, do not waste any time about them”. The point is, that time saved in reading this can outweigh your time saved in not caring about said reader.
Of course, the title of this post was chosen somewhat demandingly because the actual goal with that is consistent code. The point in such situations being, that uniform guide lines do not automatically lead to consistent expression of intention.
Aim for what your specific piece of code needs to convey, then allow the idea of choosing a style that is not the same choice as for difference pieces of code. Do not overthink it either, but do not think that deviances in uniformity are a code smell.
A more variable, more purposeful coding styles is likely to to conflict when more than one developer is involved (because of the accustomization effect), but treat it like any performance optimization – discuss it when your Merge Review is actually troublesome, with intention, not miles ahead for some hypothetical horror scenario.
One problem I often have when dockerizing my C++ Jenkins CI projects is handling incremental builds, for both our own code and the dependencies. Starting builds from scratch can take tens of minutes, too long for my taste.
My build stack is usually conan as a dependency manager and CMake/Ninja for building. Conan will usually try to download precompiled dependencies, but often enough, those are not available for my specific combination of compiler settings and flags, so it’ll build them on demand with the --build=missing flag. That usually takes the bulk of the time needed for a full build. So it makes sense to keep the dependencies cached, once they are built. However, since we use Docker to setup the build environment, they are all lost by default.
Who Owns What?
The obvious solution is to mount a folder on the build host to keep the conan cache using the -v / –volume option for docker run. This can be done by setting the CONAN_HOME environment variable, and I usually use one cache per build folder, which seems like a good compromise between speed and isolation.
But that causes other problems: docker will create all the files for the user inside the container, which is root by default, creating a whole bunch of files that the CI host user cannot delete, e.g. when a branch gets deleted. This breaks the CI setup to a point where manual intervention is required. A somewhat simple clutch is the -u user:group option to docker run, which will execute the build with the given user. The problem I was having with that, however, was that this user did not have access to user-scoped tool installations like conan via pipx.
User-specific Images
My current strategy to deal with this is to inject the host CI user and group into the docker ‘builder’ image, and then do all the building in the container using that user, as if using the CI host user on the metal. The Dockerfile looks like this:
FROM gcc:14.1-bookworm
RUN DEBIAN_FRONTEND=noninteractive apt-get update && apt-get -y dist-upgrade
RUN DEBIAN_FRONTEND=noninteractive apt-get update && apt-get -y install \
After doing the user-independent setup, this declares two ARGs for retrieving the user and group IDs, and then sets up a user with those in the docker image, calling it hostuser:hostgroup internally. Note that the names will not leak out of the container, only the IDs do.
It installs conan via pipx as that user and makes sure it is in the PATH for the build later. This is the real advantage of passing the user into the image creation: user specific things can be installed!
In our Jenkinsfile, I build the image from that while injecting the current user via the –build-arg option:
docker build . --iidfile docker_image_id \
--build-arg HOST_USER_ID=`id -u` \
--build-arg HOST_GROUP_ID=`id -g`
This expects three folders to be mounted: /source_root for the sources/repository, /build_root for the out-of-source build, and /conan_home for the conan cache. Important: make sure these folders are created by the CI user before passing them to docker, or it will create them with the wrong owner. I’m only creating the latter two, since the first one is obviously created by Jenkins.
mkdir -p docker/build docker/conan
Once the folders are set up and the image is built, I run the actual build in a container via:
docker run --rm \
-v `pwd`:/source_root:ro \
-v `pwd`/docker/conan:/conan_home \
-v `pwd`/docker/build:/build_root \
`cat docker_image_id`
That should run the actual build and populate the conan cache. After that I extract the artifacts I need and remove the docker image and ID file with:
Many long-term readers of our blog may have noticed a post about Grails Framework topics every now and then. We are using Grails for more than 15 year both in customer projects and internal ones.
Sometimes using the framework was fun, productive and bliss. At other times it could be frustrating upgrading, chasing bugs or finding workarounds. Occasionally, performance could be a problem. Most of the time it was a solid framework with solid output and customer value.
The more recent past
Ownership/stewardship of Grails changed several times over the years from one company to another. Updates were very infrequent, the general direction was very unclear and the future of the framework extremely uncertain.
Because all of the above we did not start new projects using Grails and did not recommend it to potential customers but instead used other frameworks like Micronaut, Javalin or .NET.
But suddenly there was light at the end of the tunnel: Grails was handed over to the Apache Software Foundation (ASF) in the middle of 2025 and became a top-level project there. That by itself may not be a complete turnaround and rescue for the framework, but it certainly sparked a bit of hope into the whole situation.
The presence and future
Since the adoption of Grails by the ASF a lot has changed. Tons of work has been going on in the background to streamline future development, work on reproducible builds (as required by the ASF) and to enable frequent releases, updates and improvements.
Grails 7 was born and release under ASF stewardship. The community is more open than ever and it seems to be growing again after years of stagnation or even decline.
The roadmap and plans for the next months is clear and the project is moving with a steady pace towards the goals. Of course, there is a lot of work to do, like reviving and porting several plugins to enable all users to migrate to Grails 7 and beyond – but it is happening.
Conclusion
If all the positive changes under the stewardship of the ASF continue, the future of Grails can be bright for the years to come. At least, it does not pose a liability or risk for its users and their customers anymore.
In my opinion, two things besides all the technical stuff are most important:
The strong commitment of the ASF to further develop and enhance the project provides safety for developers and customers investments
The mindshift from an exotic framework to a productive, JVM-based framework leveraging standard technologies from the java/spring/hibernate ecosystem provides familiarity and stability
Imho, this quote of the Project Management Committee (PMC) chairman James Fredley says it best:
Grails is NOT an exotic outlier. It’s PRODUCTIVITY LAYERS on top of SPRING BOOT.
Automated unit tests are the grassroot foundation of a healthy test suite. But they aren’t the only type of automated tests that we need to write in order to test a system thoroughly enough to be confident about its production readiness.
There are things like end-to-end or even GUI based tests that have completely different testing mechanics that unit tests. It is clear just from looking at the test code that they aren’t unit tests.
But for the wide range of integration tests, there is a subtle and nearly impercetible transition from unit test to integration test that is hard to explain. It doesn’t really matter on which side of the diving line between the two test types you are as long as you are close to it. But as tests evolve, you need to apply different advancement strategies to the different types of tests. One goal is to keep unit tests from becoming integration tests over time, which is prevalent when factoring out system parts that were small at first.
When things are hard to explain, we search for indicators that can serve as objective counselors and help with making the decision. For the distinction between unit and integration tests, one such indicator is the distance between motor point and reaction point. Let me explain the concepts:
Let’s pretend we need to test the implementation of a baker (or a baking machine):
@Test
void can_produce_bread() {
Baker target = new Baker();
Bread actual = target.bake();
Bread expected = new Bread();
assertEquals(
expected,
actual
);
}
This is a straight-forward unit test in the AAA (arrange, act, assert) structure:
Arrange: We build the “test world” or the slice of the system that should be tested. We call it the “target” (some call it the “cut”, from “code under test”, which corresponds nicely with the “slice of the system”).
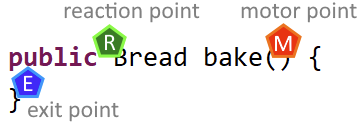
The target contains the motor point, the specific entry point where the code under test is “irritated” by calling a method. It is this irritation that causes the code under test to exhibit a certain behaviour that produces an observable result. The point where this result can be observed is the reaction point.
Act: We enable the motor point by calling the bake() method on our target baker. The code under test works its magic and gives us the result, which we call “actual”. The return value of the bake() method is the reaction point. It has two roles in the context of our test:
It provides the observable result of the code under test.
It serves as the last step of the code under test. The test framework leaves the code under test by returning the result. The exit point and the reaction point of the code under test are at the same spot (the distance between them is zero).
Assert: We compare the actual result of the code under test with our expected result. In our case, that’s a bit silly because we just want to have a bread, without any further attributes to it. But this blog post is not about the art of assertion, so we keep it simple and silly.
Let’s review the positions of the three named points:
If you read from top to bottom and left to right, the reaction point seems to be placed before the motor point. If you read it like a programmer should, you see that the point are positioned in their execution order: motor point, exit point, reaction point.
You also see that the distance between the points is very small and in the case of exit and reaction point only distinguishable if you look very closely.
That’s the indicator for writing an unit test: If your entrance to the code under test (the motor point) is effectively the same position as your exit from the code under test and the place where you get your actual result (the reaction point), you are unequivocally writing an unit test.
If the distances between the three points get larger, you are drifting away from unit tests and entering the big realm of integration tests. That is not necessarily a bad thing, sometimes it’s a necessity, but it should be a deliberate decision on your part and not an unnoticed accident.
Let’s look at an example where the distances between the points are larger:
@Test
void can_sell_prepared_goods() {
Baker given = new Baker();
Bakery target = new Bakery(
given
);
target.prepareGoods(1);
assertEquals(
Optional.of(new Bread()),
target.sell()
);
assertEquals(
Optional.empty(),
target.sell()
);
}
In this case, our baker now owns his own bakery where he can sell his breads to make a living. But baking breads “just in time” a customer requests one is not a sustainable business model, so the bakery has to prepare in advance and sell from the supply.
To test that we can fill up the supply and it gets emptied correctly, this test (in combination with other tests not shown here) does the AAA structure again:
We arrange our test world by inventing a baker and giving him to the bakery, which is the target in our case. We want to test the functionality of the bakery and a baker is required to do so. We already asserted that the baker knows his trade.
Then we act on our target. This is the motor point moment: We call the code under test to elicit a behaviour. But as you can see, we don’t receive a result right away. The effect seems to happen internally and we need to observe it from a different angle. Our reaction point has moved away from the motor point. And we have several exit points on our test journey. This is getting complicated!
In order to assert that the bakery’s supply holds one bread when told to prepare only one, we just buy two breads consecutively and see what happens. If there is only one bread in supply, we should get a bread the first time and nothing for our second purchase. The reaction point is now the sell() method, a good distance away from the prepareGoods() method we used as the motor point. Both points are (hopefully) connected by internal machinery in the bakery. We don’t want to assert the internal machinery, we want to assert its outcome. This requires the distance between motor point (“pressing a button up here”) and reaction point (“getting a product down here”).
You might argue that this example is still an unit test and I would agree. But we already see mechanics that occur predominantly in integration tests:
Elaborate arrange steps
act step without a return value (“actual” is missing)
Multiple assertions, telling a story with their order
When you imagine that the breads need to be of different kinds (dark bread, wholemeal bread, the whole german bread culture), you can probably see how the small unit test we just wrote kind of explodes with secondary complexity.
A realiable indicator that an automated test is going to be complicated is the distance between motor point and reaction point. Once you know about the concept, you can incorporate it into your testing intuition.
I hope it helps you write better tests or write good tests more deliberately.If you have thoughts about the concept, share them in a comment!
Recently I ran into a problem that only showed up outside the development environment.
I had a small script that needed to iterate over all records in the database and load blobs.
Document.all.eachdo |doc|
process(doc.blob)
end
With a small dataset everything worked as expected. With production-sized data, however, the job was terminated by the runtime with an out-of-memory error.
This behaviour is not surprising once you look at what all.each actually does.
How all.each works
When calling all.each ActiveRecord is loading the complete result set into memory before the iteration starts. For large tables this means that thousands or even millions of Ruby objects are instantiated at once.
If each record also references additional data — for example blobs, attachments, or associations — the memory usage grows quickly.
Loading Records with find_each
ActiveRecord provides find_each for exactly this scenario:
Document.find_eachdo |doc|
process(doc.blob)
end
In contrast to each, this method does not load all records at once. Instead, records are fetched in batches and yielded one by one.
Conceptually the process looks like this:
Load a limited number of records
Yield them to the block
Discard them
Load the next batch
By default, find_each loads records in batches of 1000. The batch size can be configured:
Document.find_each(batch_size:100) do |doc|
process(doc.blob)
end
find_each always iterates in primary key order. This means the model must have a primary key that is orderable like integer or string. Any explicit ordering will be ignored.
If more control is required, find_in_batches can be used instead. It requires manual iteration over the batches.
Conclusion
Iterating over large tables with all.each is easy to write but can lead to excessive memory usage once the dataset grows.
For batch processing tasks, find_each is usually the safer default because it limits the number of instantiated records and keeps memory usage predictable.
When software has grown over some years, or split into multiple moving parts, or both, chances are that a customer reports erroneous behaviour that cannot be represented in unit tests. You might then need an integration test, and while these have the advantage of resembling more the story of what your customer wanted to do and expected to see – one can feel a larger degree of freedom, or rather, a larger question mark, in what they actually should know or assume.
And especially when you are not the original author of said code base, it might be especially tricky to strike the right chords; so with this post, I try to specify a few heuristics to find the right scope, the right aim for such a test.
Now first of all, try not to aim too needlessly large. As in – when possible, prefer unit tests, and if you can’t, be intentional about writing an integration test. As Daniel laid out in a series of blog posts some years ago, you can think of a unit test as a theater play, and using these metaphors helps in making your test clearly convey what it is about. The largest impact is in identifying what the “target” is. It has to contain the code under test (“cut”, also), and it should be very clear who that is (think of a simple stage play, not some avantgarde David Lynch mystery thriller). To perpetuate that idea – unit tests are these that define the character of your target; who is our hero, in their inner core, regardless of the context?
As you knew beforehand, totally™ – writing the test in advance gives you a clearer overall understanding of your actualy problem. Any kind of test. If not done, for whatever reason, you might either now switch to a fresh branch and do so – or, at least, treat any test code as it could have been written before. I do stress this because it can be too tempting to focus on specific implementation details, but if some interna are rightfully encapsulated, hidden from other production code, then your tests should also not see these things.
Do not change any field or method visibility in order to make your test work.
More “freedom” is deceptive. Integration tests tell the behaviour of your target-hero within a given backstory, but how much backstory do you need? And can you keep up the storytelling – imagine yourself to be a cliche Gen Z TikTok user that ran short of Methylphenidate – would you still follow the story, after describing that one tree over here, these cars over there, who owns them, and the general idea of a planet where all that takes place?
But in said codebase grown-over-years, it might still be hard to aim right. A “quick” way out (speaking in time of writing that test) would be to try to mock away everything you need to construct your target; but you shouldn’t do so on first sight.
For every argument, any dependency that your situation needs, get at least a coarse understanding of what it is used for, and why not a version of that entity could exist without that dependency. Take that time. This can feel like a detour, but either it reveals to you how the backdrop actually looks, or it might even give you a hint of needless coupling in that existing code base.
Either way, does every single line of the test reveal its purpose? (you should apply that question to any line of production code as well, but the cases where it’s just not possible is larger there than it should be within tests.)
And then there’s the point of deduplication. As stated, tests can exist that have a bit of scaffolding to them. It’s not illegal. But consider that any behaviour covered by an integration test probably has some variations – stuff happens in a different order – and when several tests have the same setup, this might encourage outsourcing a “setup helper” method. You even should do so (imo) if you clearly want to say “in this scene, everything is the same as yesterday, BUT THEN…” but if you do so, keep one thing in mind: that setup function needs to show the same clarity that is required of the tests themselves.
If your setup functions exceed any trivial logic that makes it feel like you require an extra test just to prove that your test setups works, stop and rethink.
So this list surely is incomplete, and as stated, they are rough “heuristics”. But if you have a nontrivial case to test, and do so in a project that is not completely in your brain right now, but just might want to somehow draw the line between “what should I (or the test) need to know” and “what is to be mocked or otherwise left out” – maybe these thoughts can help you too.
And if you disagree, I will be very glad to consider your stage plays.
Today I stumbled upon some behavior in C#’s List<> that I found very surprising. I had forgotten about RemoveAll() and basically implemented it myself:
var target = 0;
foreach (var each in list)
{
if (!predicate(each))
list[target++] = each;
}
list.RemoveRange(target, list.Count - target);
Apparently, this is not allowed. You cannot assign to any element in the List<> while you are iterating/enumerating it: The List<> implementation holds a ‘version’ number that is incremented any time a change is made, including assignments. When the Enumerator is advanced via MoveNext it checks for this version and throws the dreaded ‘Collection was modified’ exception.
Except that there shouldn’t really be a problem here, and the modification checking code is basically being too coarse. This code ‘compacts’ the list, copying elements where the predicate evaluates to true to the front of the list, and then cutting off the rest of the elements. There’s never really any doubt what each references. In fact, in other languages, this approach is even considered idiomatic to remove elements while iterating. In ancient C++, this is known as the remove/erase idiom, see also std::erase.
So why did the library designers of C# consider setting a value while iterating a problem? I don’t know, but at least now I have a story to remind of of RemoveAll()‘s existence.