
Imagine you have a grid structure with some of the tiles marked as blocked while the others are free. So a grid with zeros (free) and ones (blocked), in other words: a bitmap. Something like this, with blocked tiles marked as blue:
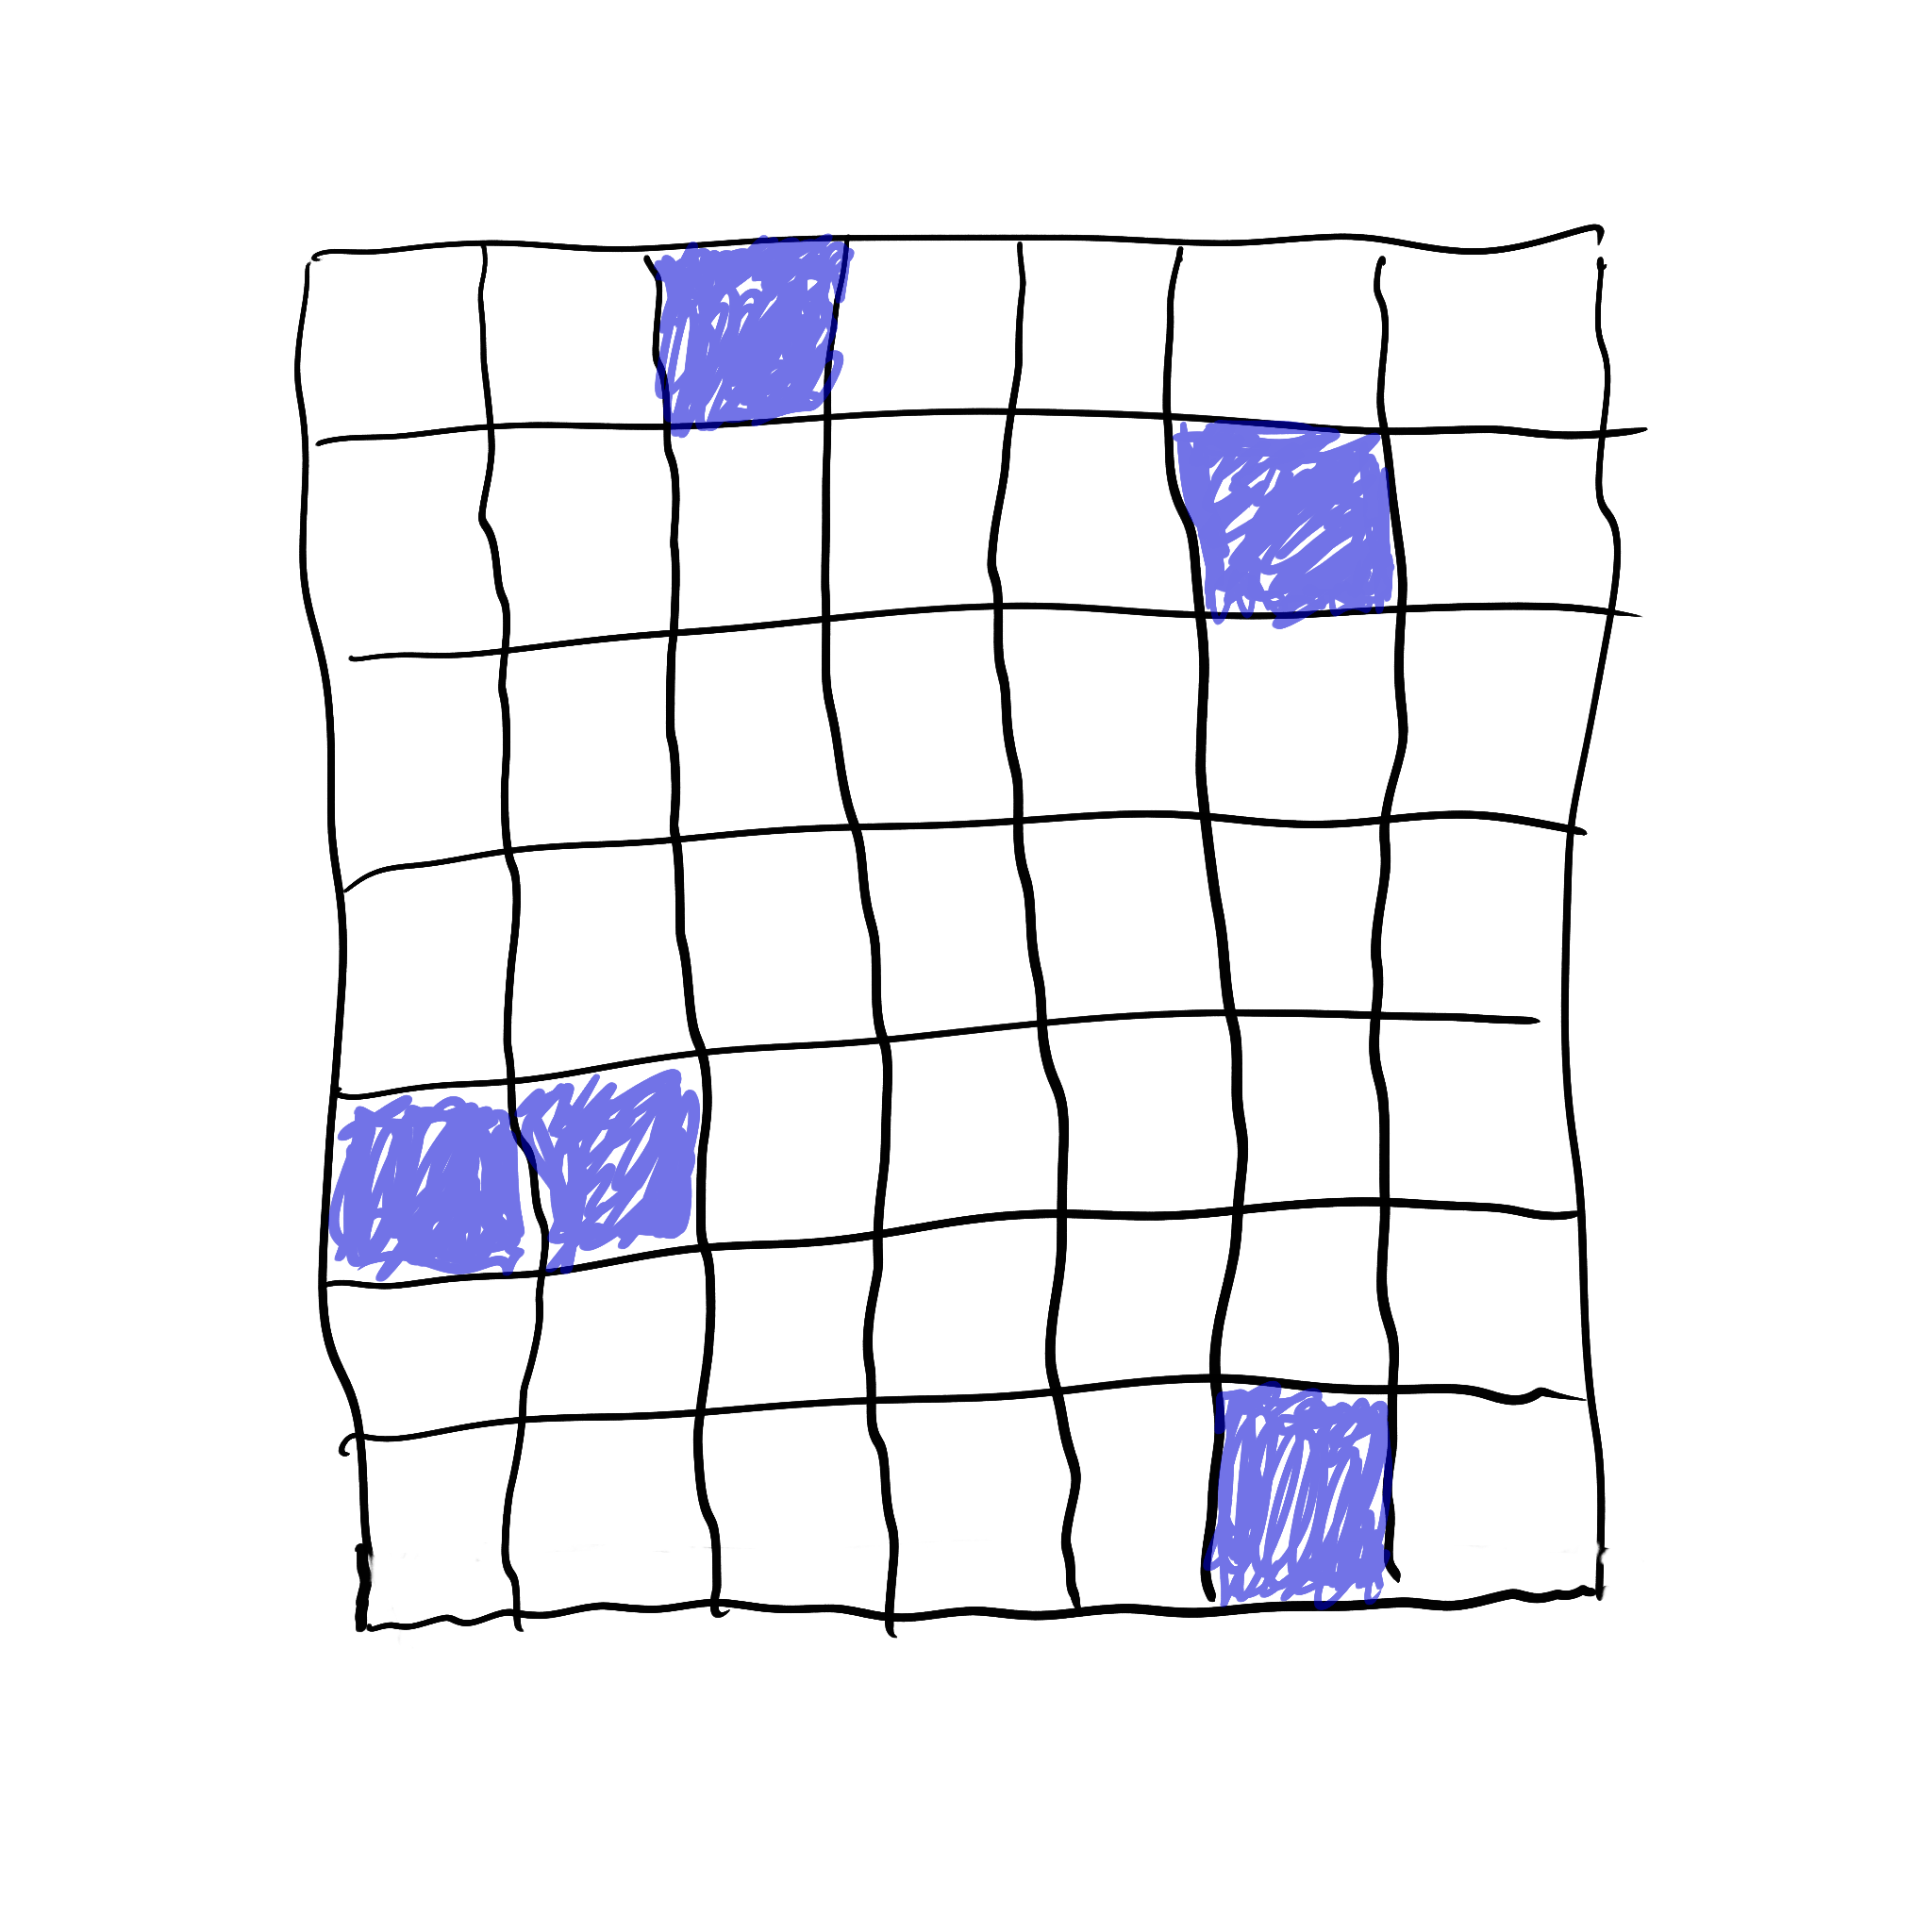
Now the task is to figure out the biggest rectangle you can fit into this bitmap without using any of the blocked tiles, using an interface to the grid that can test single tiles, like bool test(x, y).
The naive version to solve this involves quite a few nested loops:
bool test_rectangle(int x0, int y0, int x1, int y0): for y in [y0 .. y1]: for x in [x0 .. x1]: if (test(x, y)): return false return truebest_rectangle <- nilbest_area <- 0for y0 in [0 .. h): for x0 in [0 .. w): for y1 in [y0 .. h): for x1 in [x0 .. w): area <- (x1-x0+1)*(y1-y0+1) if (area > best_area && test_rectangle(x0, y0, x1, y1)) best_rectangle <- {(x0,y0) (x1,y1)}
This is in O((w*h)³), so it can be pretty slow for bigger bitmaps. But there is a much more clever algorithm that I only learned about recently and I feel like it is not easily derived but quite interesting, so I want to show it here.
The algorithm
Start by going through the bitmap row-by-row and keep a count for each entry, initializing all to 0. For each bit, check if it is blocked. If yes, set the count to 0, otherwise, increment the value from the previous row.
With the example from above, the 5th row (going top to bottom) would look like this (in red):

Note that we don’t have to store all the numbers, just one row. I’ve kept the other numbers in orange merely for illustration purposes.
The numbers say how much you can go up without touching a blocked bit. Now we can treat each position as a potential “base point”, a point on the bottom edge of the candidate rectangle with the current number as the height. We just need to figure out how for left and right we can extend the candidate, which can easily be solved by going into both directions while the numbers there are at least the current height.
Consider the current row: the two zeros are obviously no candidates. The 4 cannot be extended to the left, because the left neighbor is already a 0. But it can be extended over the two 5s to its right. So the candidates size at the point is 4*3=12. The 5s themselves can only be extended one column, covering the respective other 5. So their candidate sizes are 5*2=10. The 3 can be extended all the way to cover the 4 on the left side and the last column’s 5 on the right, so the size there is 3*5=15. The last column’s 5 can not be extended at all, so it’s just 5*1=5. So the largest rectangle generated from this row is the one with the 3 as the base point. Repeat this for all the rows, and you will eventually find the biggest rectangle in the whole bitmap.
Even faster
You probably noticed that I omitted how to exactly figure out where the next smaller element on the left/right side is. You could just use a find-type loop in both directions and be done with it. That’d only add a factor h to your runtime, which should be sub-linear (in O(sqrt(n))) if you make sure h is not the greater of the two dimensions by transposing the image.
But you can actually do it constant time after a linear preprocess on the row: For each element in the row, store the next smaller element to the right. You do this by building a stack while the numbers are not decreasing, and unwinding that stack when they do. For each unwound number, note the current position as the next lower. The unwind goes on until the top of the stack is actually lower than the current again.
Do that in reverse too, to find the previous smaller element for each entry, and you can lookup the rectangle widths in constant time.
Taking our example row [0, 0, 4, 5, 5, 3, 5] again, we start with:
monotone_stack: []next_lower: [7, 7, 7, 7, 7, 7, 7] // Past-the-end is the default
On the 5 iterations, not a lot happens, since the numbers are not decreasing. Note that the stack contains the indices, not the values:
monotone_stack: [0, 1, 2, 3, 4]next_lower: [7, 7, 7, 7, 7, 7, 7] // Nothing changed yet
But at position 5, we need to start unwinding the stack. The 4, 3 and 2, corresponding to values 5, 5 and 4 have to go, and get our current position (also 5) as the next_lower, while the current position is added to stack.
monotone_stack: [0, 1, 5]next_lower: [7, 7, 5, 5, 5, 7, 7]
The 5 in the last column is again higher than the value referenced by the top of the stack, so it just gets added to the stack and next_lower stays the same. A word on the default value: 7 (=w) works well here, since we can extend the rectangle always to one-minus-the-next-lower. When its 7, this means we can extend right up to 6, which is the last column. When doing this algorithm from right-to-left for the previous-lower, you’d actually use -1 for that.
I’ll leave the steps to you, but the result for prev_lower should be:
prev_lower = [-1, -1, 1, 2, 2, 1, 5]
With those values, the width of the candidate at position x should be next_lower[x] - prev_lower[x] - 1: remove 2 because the lower values cannot actually be included, add 1 back because the interval is inclusive.
With all this, the algorithm actually ends up in O(w*h). The second part of this algorithm is actually called Largest area in histogram.

