
When I’m tasked with commenting on a software architecture, my first step is to request or draw a map of all distinguishable elements of the software system and give them relationships to each other. This inevitably results in a boxes-and-arrows type of diagram that serves as a base for all future communication about the subject. Having a shared representation about a system is a great way to pinpoint discussions and focus on a particular area without forgetting the rest completely.
When I’m tasked with commenting on IT infrastructure, my first step is to request or draw a map of all distinguishable elements of the IT architecture (or “IT landscape”, a term that I actually prefer because it conveys better that a lot of things on this scale happen unplanned) and give them relationships to each other. Once again, we are drawing boxes and connecting them with arrows.
Being able to rely on this map is an essential base for all communication about IT architecture. And if you know how to read the map, it directs your efforts of consolidating your IT architecture nearly intuitively.
In this blog entry, we talk about drawing the map. The second part goes into interpretation of the map, the third part emphasizes actionable steps based on the map and our interpretation of it. Based on questions and discussion, there might even be a fourth part, but that’s not planned yet.
Your initial boxes
Beginning the IT architecture map is easy: Draw a box and give it a name. The name should correspond to an element of your work environment that is distinguishable from other elements. Note how I don’t say “system” or “service” or “server”. For an IT architecture, these words describe an implementation, a particular manifestation of the architecture. They don’t belong on the map (or this map). If you cannot see the difference yet, think about the floor plan of a house. It doesn’t tell you about the material the house is made of and you can use the same floor plan for a wooden cabin or a marble mansion (barring some pesky statics limitations that I don’t have a clue of). In our IT architecture map, each box represents a “thing” that will at the latest get a name the minute it stops working.
There will be boxes in your IT architecture map that don’t relate to anything else. That’s fine and not a problem, as long as the box relates to humans. If you cannot find a meaningful relationship between the box and humans or other boxes, you’ve found a relict. This is in fact one of the hardest tasks in IT architecture analysis, so congratulations!
Adding relationships
Every other box interacts with its environment in some manner. Again, the concrete implementation of that interaction is not important for our map. For our current view on the landscape, it makes no difference if a software system uses HTTP calls to a server or a computer tranfers bytes over RS232 wire to an appliance box. The fact that one box relies on the availability of another box is all that matters. That’s the essence of our arrows: Box 1 requires box 2 to be “online” in order to perform its duties. Without box 2, the functionality offered by box 1 will be limited, down to a point where it is no longer useful to others. Our arrows denote dependencies between boxes. If you happen to be a software developer: we don’t talk about code dependencies here. Also, even if closely related, we don’t mean format or protocol dependencies. We just state that if box 2 “goes down”, box 1 will follow closely.
This is the base for a rule of thumb about dependency arrows: Don’t draw them bidirectionally. Each arrow has one clear direction (like box 1 –> box 2). If you find that box 2 also depends on box 1, you should draw two arrows in opposite directions. As a preview for the interpretation step: This dependency cycle is a sore spot in your current architecture. It means that your two boxes appear as one to the outside. It means that you cannot replace one part without the other. The replaceability of single boxes is an important aspect of your landscape’s health.
Making it readable
When you’ve placed your boxes and drawn the arrows, it’s time to improve on the map’s layout. A guideline for the layout is that arrows shouldn’t intersect each other. Another guideline is that boxes that are semantically related should be near each other on the map. These two requirements alone often result in a lot of movement and experiments. You might want to use a software that allows for these experiments without much effort.
You’ll recognize a fitting layout when you see it. The map corresponds to your internal landscape representation enough to be useful in discussions. It might look like this real example:
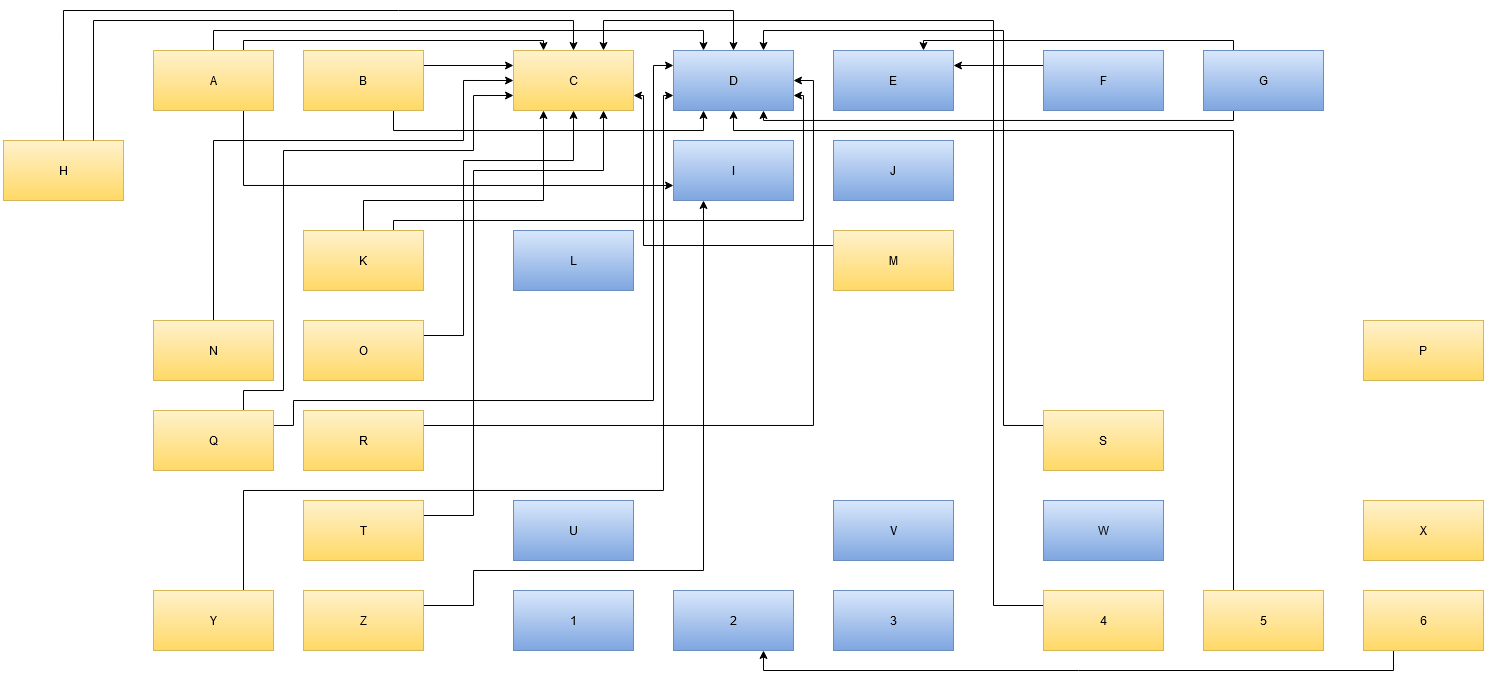
First thing you’ll notice it that the names are replaced by denotations with zero meaning. In a real map, the box “C” might be named “time tracking” and box “D” could be labelled “issue tracking”. The name should indicate the responsibility of the element/box. You can also add the current implementation of that responsibility, if that makes things clearer. In our example, box “D”, indicating “issue tracking” might have “(JIRA)” added to the description. Just be aware that your organization probably needs another issue tracking system in that place even if JIRA falls out of favour. Following your arrows backwards, you’ll know which other elements of your landscape will be affected by this replacement. More on that in the next part about interpreting the map.
Evolving the map
Another thing you probably scoffed at is the intersecting arrows in the example. The map’s author came up with this layout as the best representation when the map had fewer boxes. With each subsequently added box, another arrow or two tried to reach the “center”. The intersections are a direct consequence of the emergence of a “center”. This is an important finding of your map: Being able to identify your map’s center and deduce meaning from it. To spoiler a bit: If your center is “time tracking” and “issue tracking”, you probably charge money per hour to solve other people’s problems.
Conclusion
You’ve probably seen how drawing an IT landscape map can benefit your organization and your discussions about its present and future. One thing you should keep in mind is that the map should reflect the current state and not your desired state of your organization’s IT architecture. That’s what will be addressed in part 3 of this series. Stay tuned!
Want to read more? Head over to part II of this series.

2 thoughts on “The IT architect, Part I: Map your assets”