
If you want to work on the scale of an IT landscape, you need to have a plan in the form of a map. In the first part of this series, we talked about creating such a map. This blog entry will give you the basic tools to make sense of all the things on it and how to convey meaning to other people while using the map.
The third part will talk about actionable steps that are a result of our interpretation of the map.
Making sense of the map
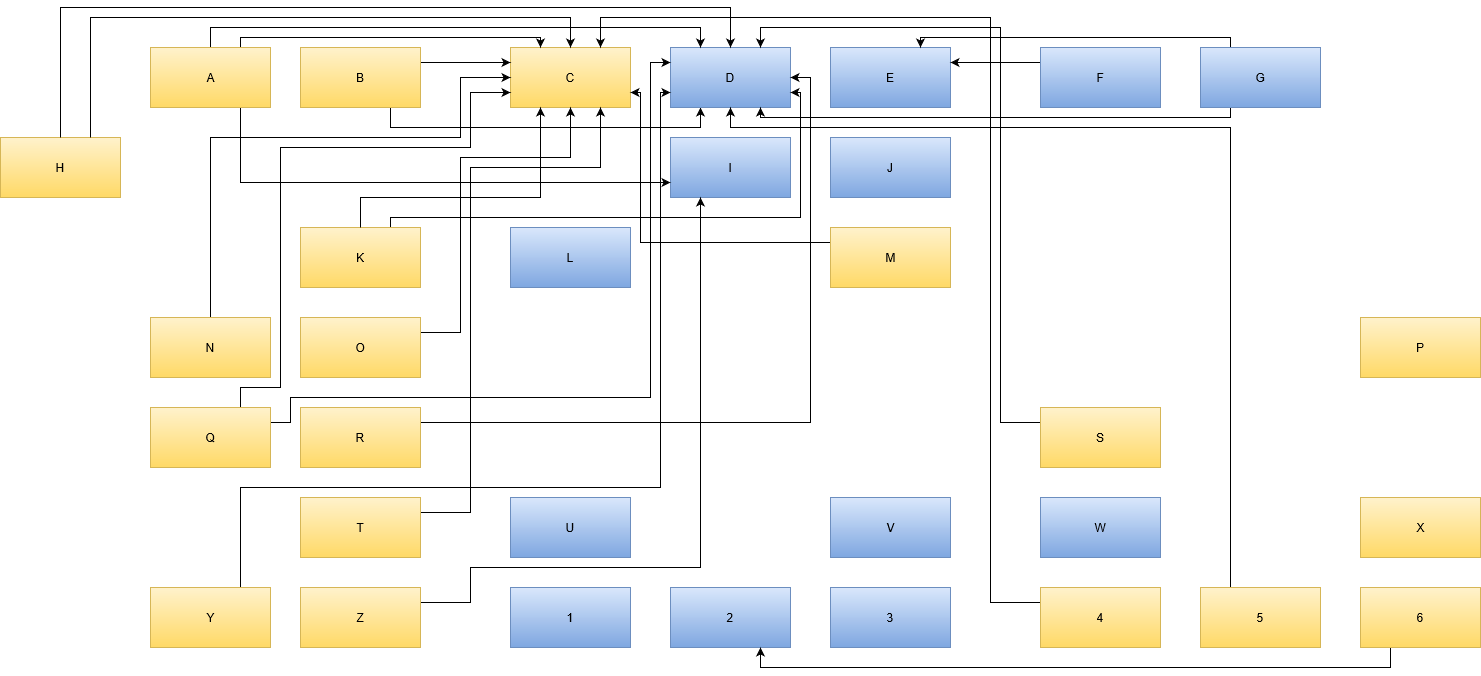
You’ve drawn the map of all your IT assets and given all the boxes names that you find useful. You’ve asked around to find relationships between your assets, represented by arrows between the boxes. You’ve moved the boxes around a bit to reduce arrow intersections. The map seems to be as “clean” as it can get at the moment.
Now is the time to apply meaning to the structures you see.
Interpreting loners
The first thing you want to look for are boxes without any relationships. These entities don’t interact with other things on your map and are not required by anything, too. Let’s think of them as independent value sources. If this asset brings your organization a describable and current advantage, you’ve found the ideal asset.
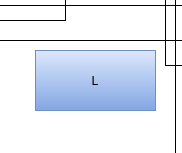
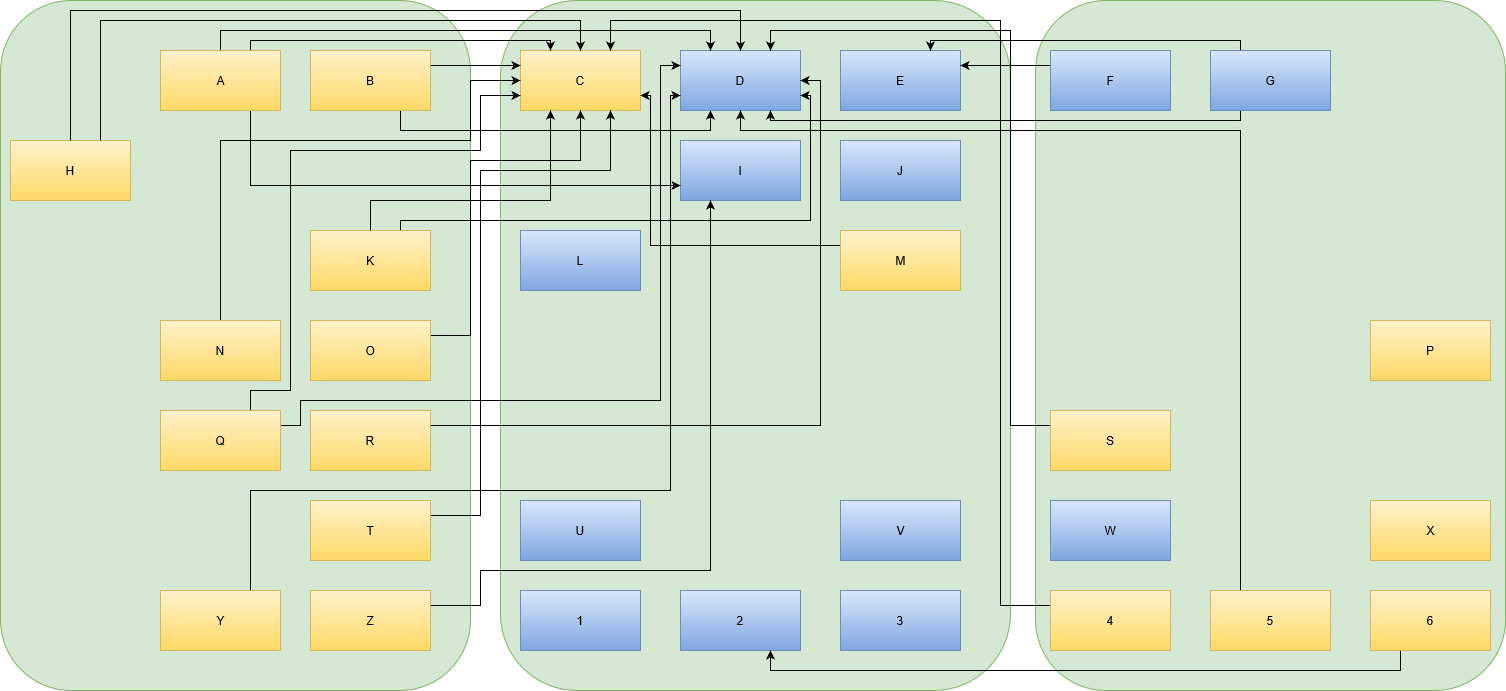
An example could be the blue box “L” in our example map. It isn’t coupled to any other asset. Let’s say it is a “customer relationship management” (CRM) system. Remember, boxes are not labeled by their actual implementation (in this case, maybe a vTiger or SugarCRM), but by the value they provide for the organization. If your organization needs a CRM (or benefits from its presence), then you have a “loner”, which is a good thing.
If the CRM stops working, the humans in the organization will be unhappy about it, but the outage itself will be limited to the CRM and not spread to other parts of your IT landscape (given that your map reflects the reality). If the outage lasts longer, your employees will adapt their work processes to circumvent the pothole in your IT. There will be a lot of post-it notes, at least for some time.
If the CRM is updated to a new version, you need to train your employees, but it won’t require other IT entities in your organization to match that update. The CRM can run on ancient hardware and software, as long as the human requirements are met. A loner on your map is a good thing.
Interpreting relicts
If you find a lonely box without a current use case, you’ve found a relict. Be glad that you’ve found it, because relicts tend to remain hidden and not show up on architect maps. If you can make sure that the relict serves no purpose for the organization anymore, you can eliminate it. Removing an asset from the map (and your real IT infrastructure) is a good thing, because you reduce complexity, costs and risks. There is no IT asset without associated costs and risks.
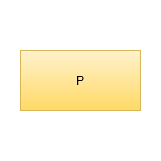
If, for example, the yellow box “P” represents a computer that provides a service that nobody uses anymore, the computer itself is still present in the network and can be used as a stepping stone for malicious itents. Let’s say the computer is a Raspberry Pi that isn’t included in the first tier of workhorse computers, its operating system might be outdated and susceptible to attacks. It doesn’t provide value for the organization anymore, but it increases the organization’s risk.
Revealing this kind of “dead weight” in your IT landscape is a real advantage, because you can cut it out rather easy.
Interpreting rings
A typical structure on your map could be a circular dependency. In its smallest form, it is just two boxes that both depend on each other. The more elaborate ring consists of several boxes that are connected without a clear start and end. This is the worst thing to find.
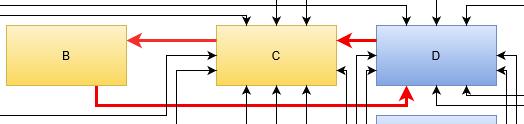
A ring in your entities means that you have to consider all elements in the ring as one big entity. You cannot modify them independently, neither on the technological level nor on in the temporal dimension. A ring is basically a mexican standoff situation for all included entities. You can also call it a deadlock. Whatever you call it, it is bad news. You probably want to break the ring as soon as possible.
Breaking a ring would warrant its own blog post altogether. A basic starting point might be the Acyclic dependencies principle of software design. You probably need to split at least one of your entities into smaller parts or introduce a new entity. The least favorable move would be to merge all entities into one bigger entity, creating a monolith. You will regret this move when the inevitable modernization pressure rises.
Interpreting chains
If your entities form “deep” dependency lines where A depends on B, B depends on C, C depends on D and so forth, you have discovered a chain. This structure is less troublesome compared to the ring, but worth a worry nonetheless. In terms of operational risk, the chain creates a meta-system with a failure rate that is the sum of the failure rates of the chain elements. To make a long story short, you’ll never get a reliable infrastructure with long chains.

The longer your chains are, the more ripple effects an outage will have on your IT landscape. Remember that a chain always breaks at its weakest link, but this link will bring down the whole line.
You can reduce the length of a chain of entities in your IT landscape by inserting buffer elements like read-only copies of central data sources. But more important is to think (and talk) about why the dependencies are there in the first place. Maybe your data storage strategy is too decentralized and you would gain some favorable dependency structures by pooling data together (essentially creating a data monolith if you overdo it).
Introducing zones
Recognizing the basic shapes on your map is important, but you also have to look at the forest and not only the trees. The basic layout of your boxes already tell you a lot about your IT landscape zones.
A zone on your map is a region of boxes that you can encircle and give it a superordinate name. The basic rule of a zone is that all entities in it should share a common property. The less technology-based this property is, the better is your zoning. A zone for “java web services” or “metal computers” is eventually useful, but won’t stand the test of time. Sooner or later, some java services are replaced by other programming languages and some real machines get virtualized. Do you move them to other zones on your map? What really changed for the users of your IT landscape?
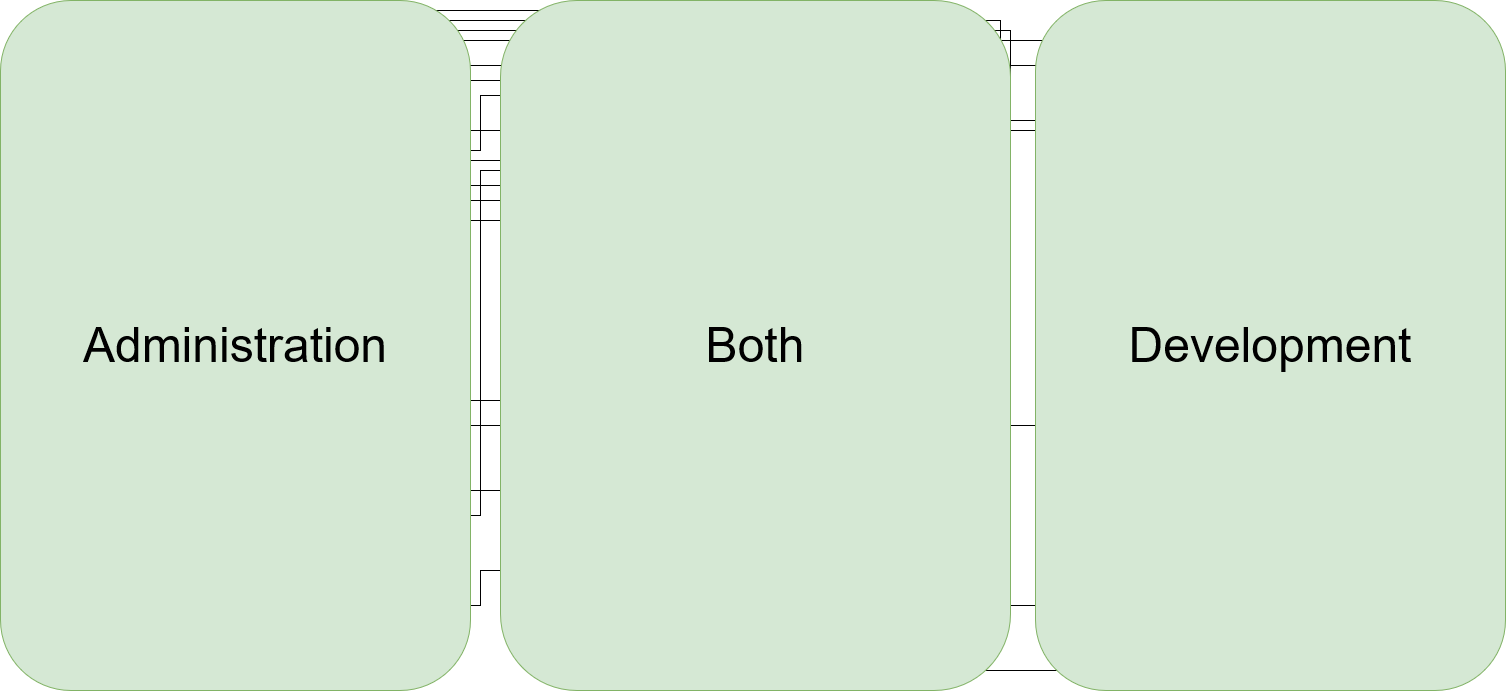
If you concentrate on your users, you might be able to come up with properties that really affect them. Look at this example that takes our initial example and separates it into three zones:
And now, we find a user-oriented name for each zone. In our example, we’ve grouped the entities by user role and are now able to label our zones:
This grouping has the added advantage that the target audience for each modification to the map can be identified nearly immediately. It makes it easier to anticipate the effects of outages or problems and to identify non-cohesive usage of the same tool/entity.
In our example, each box in the “Both” zone is essential to the functioning of the organization. But just because a specific service is used by both other groups doesn’t mean they have overlapping requirements. Maybe it is better for everybody involved to actually divide an entity into two separate boxes in the respective zones, even if both boxes are implemented with the exact same tool/technology at the moment.
Identifying the zones takes your map to the next level. You end up with fewer, but bigger boxes and their dependencies. It’s the same IT landscape, but with less detail. Now you can start your discovery process again.
Conclusion
Your IT landscape map can be interpreted by looking for common structures (like loners, rings and chains) and by defining zones. This allows us to gather a list of problem points that we want to improve. It also allows to evaluate the expectable ramifications of changes to entities in our IT landscape. And there will be changes. The one (and probably only) constant in IT is that all things change.
In the next part of this series, we look at ways to transform the map from the current state towards a better one. Stay tuned!

2 thoughts on “The IT architect, Part II: Assess your situation”