Analyzing Java Heap problems Part 1: Basic actions and tools

You think that your shiny Java app has some memory issues but how do you find out if that is true and what is taking up all that memory? Knowing the potential problems is fine. Nevertheless you still have to find out your actual problems. There are several instruments available to help you analyse your Java application regarding its memory usage. I will tell you about increasing your maximum heap (most of you surely know  about that), looking at the memory of a running app, making heap dumps (on demand or on OutOfMemoryException) and analyzing the dumps.

Increasing maximum heap

The Java VM has a setting that defines the maximum amount of heap memory available to your application. It defaults to 64MB which is enough for many programs. If you have a larger application you should try to start it with that value increased by passing the -Xmx<size>m parameter to the VM at startup. <size> is the value in MBytes so just fiddle around with that. If your app is leaking memory that won’t help you for long so you have to find out *if* it leaks.

Looking at memory usage of a running application

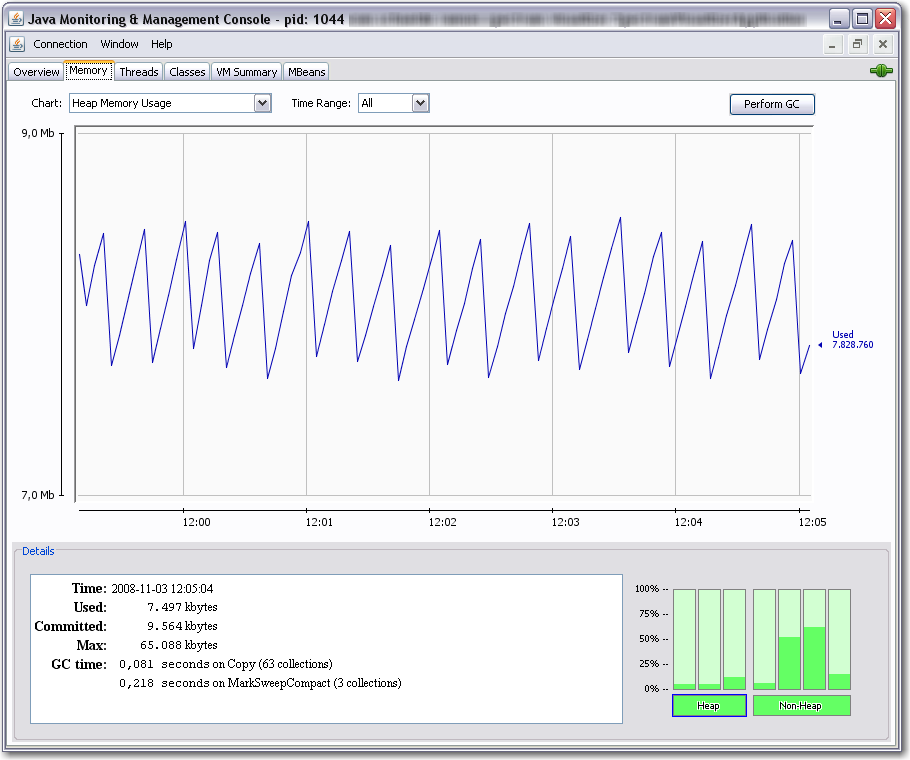
You can use jconsole for a quick look at your applications resource usage. jconsole is part of the Sun JDK since Java 6. You can connect the jconsole to any running java applications on your computer or even reachable over network and offering the Java Management Extensions (JMX) over TCP. Non-leaking programs should have a memory graph like this:

You can see, that the memory fluctuates over time because of the garbage collection cycles. But overall it does not grow. Next we will look at an application that leaks memory:

Above we see that the garbage collector (GC) tries its best but the used memory is growing over time. If we see such behaviour we probably need a heap dump to analyze the issue further.

Making a heapdump

Basically you have two nice ways to get a heap dump of your application which you can look into at a later time:

  1. Use jmap (which is also part of the Sun JDK 6) to dump the heap of a running application to a file using a command line like jmap -dump:format=b,file=myheap.hprof <pid>
  2. Tell the VM to make a heap dump when an OutOfMemoryException occurs by adding -XX:+HeapDumpOnOutOfMemoryError to the VM parameters at startup. With another switch you can specify the path for the dumps: -XX:HeapDumpPath=jmxdata .

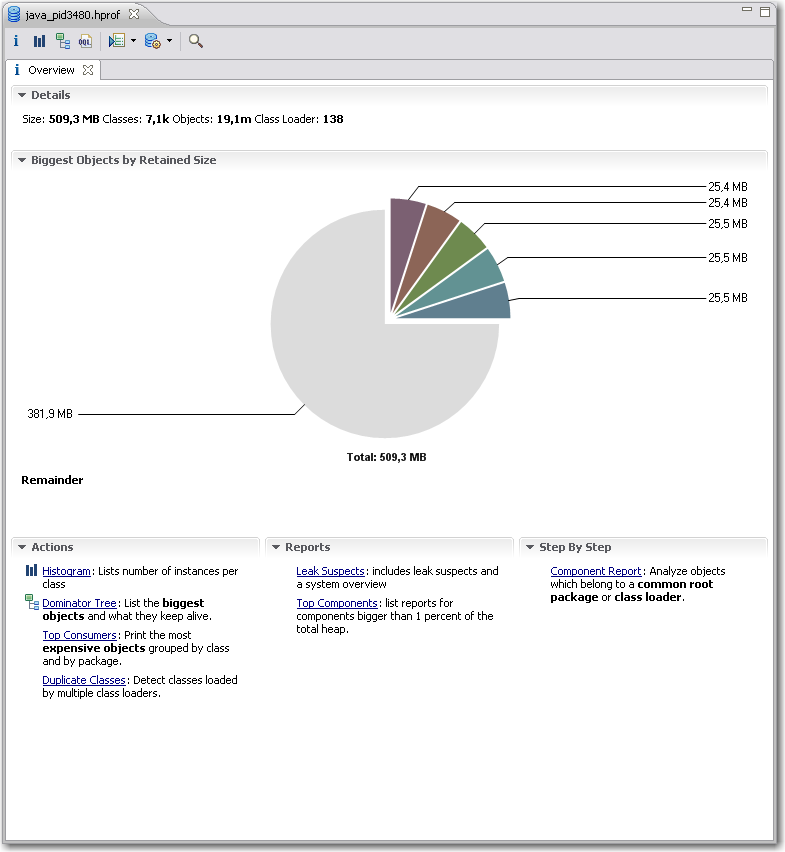
After you have obtained a dump of your application you certainly want to have a look at it and find the issues. You can start with Sun’s jhat which is also part of current JDKs. After supplying jhat the hprof-file you can point your browser to the integrated webserver of jhat and browse the heap looking for the objects that take up your memory.

That way you can get an idea of what objects lived in memory when the heap dump was made and how they were referenced.

Conclusion

We have seen many ways to perform memory diagnostics using only free tools which are part of the JDK from Sun. They are all nice but have their limitations. Especially jhat has problems with usability and performance when you examine larger heap dumps with it.

Next time I will show you how to use the Eclipse plugin MAT for analysis of heap dumps obtained in one of the above ways. So stay tuned!

Java solves all memory problems, or maybe not?

Many people think that Java’s Garbage Collector (GC) solves all of their memory management problems. It is true that the GC does a great job in many many real world situations. It really eases your life as software developer especially compared to programming in languages like C /C++ where memory management is a major PITA. Even there you can help yourself by using object systems with reference counting, smart pointers etc. but you have to be aware of this issue all the time.

So everything regarding memory is fine in Java?

Actually not really. Many Java developers do not think about code potentially leading to memory leaks. I would like to point out some problems we encountered. The problems can be divided into two categories:

  1. Native resources which have to be managed manually
  2. Listeners attached to central objects which are never removed again

Examples of native resources

Database connections, result sets and so on are a very common native resource that need manual management. JDBC is a real pain regarding resource management and especially Oracle is very susceptical to leaking those. Either you are very careful here or you use some framework to help you. If you do not want to go the whole way to a persistence framework like hibernate, iBatis or toplink a solution like Spring JDBCTemplate may help you a lot.

Another example is the JOGL TextRenderer which has to be manually disposed or you will leak texture memory  and soon run into resource problems.

Files/Streams and Sockets should be handled carefully too. In most cases you are more or less in the same boat with the C/C++ people but using finally can help you there.

Examples of listener leaks

Sometimes something innocent looking like a Swing Component can turn into a memory leak. We used JDateChooser one of our projects and found some of our data displaying dialogs to exist several times in memory and thus taking huge amounts of RAM eventually leading to OutOfMemoryExceptions. In case of dialogs and windows a WindowListener might help.

Sometimes you might write similar objects yourself that register to some central instance (maybe even a singleton *yuck*). Deregistering them always is easily forgotten or overlooked. A common code pattern to look out for listener leaks where you cannot deregister easily at the right moment is the following:

public class MyCoolClass implements IDataListener {

    public MyCoolClass(IDataProvider dataProvider) {
        super();
        dataProvider.addDataListener(this);
    }

    ...
}

Avoid such constructs as they can prove really dangerous. There is more that can be done to lower the risk of hard-hitting memory/listener leaks: Use WeakReferences for listener management at the crucial central objects. The referenced objects are taken care of by the GC and the listener manager has to take care of the WeakReferences. They can be cleaned up periodically or when a notification takes place.

Conclusion

The Java GC helps a lot in everyday programming but there are still things to look out for. Just be aware of the resources you are using and think about their need of management. I will write some follow up articles about getting heap dumps in different situations and searching them for memory leaks using some nice free tools.

Update:

Kris Kemper wrote a nice article about Swing Memory Leaks with JCalendar and a solution to the problem.

== or equals with Java enum

When you compare objects in Java you should prefer the equals()-method to == in general. The reason is that you get reference equality (like with ==) by default but you are able to change that behaviour. You can override equals() (DO NOT FORGET TO OVERRIDE hashCode() too because otherwise you will break the general class contract) to reflect logical equality which is often what you want, e.g when comparing some string constant with user input.

With primitive types like double and int you are more or less limited to == which is fine for those immutable value types.

But what is the right thing to to with the enum type introduced in Java 5?
Since enums look like a class with methods, fields and the like you might want to use equals() instead of ==. Now this is a special case where using reference equality is actually safer and thus better than logical equality.

Above (please mind the stupid example) we can see that comparing the EState enum with an ILamp using equals() is accepted perfectly by the compiler even though the condition never can be true in practice. Using == the compiler screams and tells us that we are comparing apples with oranges.

“Poor man’s reporting” oder Ultraleichtgewichtiges Java Reporting

In den meisten unserer Softwarelösungen wird irgendwann irgendeine Form von Reportdokument erstellt. Meist fällt dem Kunden ein, dass er gerne ein hübsches Pdf mit Messwerten und ein paar Diagrammen hätte. Im Laufe der Zeit haben wir diverse freie (sowohl wie in Bier als auch Rede) als auch kommerzielle Lösungen ausprobiert und eingesetzt. Darunter sind u.a. Jasper Reports und RReport, jedoch hatten sie alle ihre mehr oder weniger großen Haken und Ösen. Die meisten teureren kommerziellen Lösungen (wie z.B. Big Faceless PDF) kamen wegen des jeweiligen Projektumfangs und den wenigen benötigten Features nicht in Betracht.

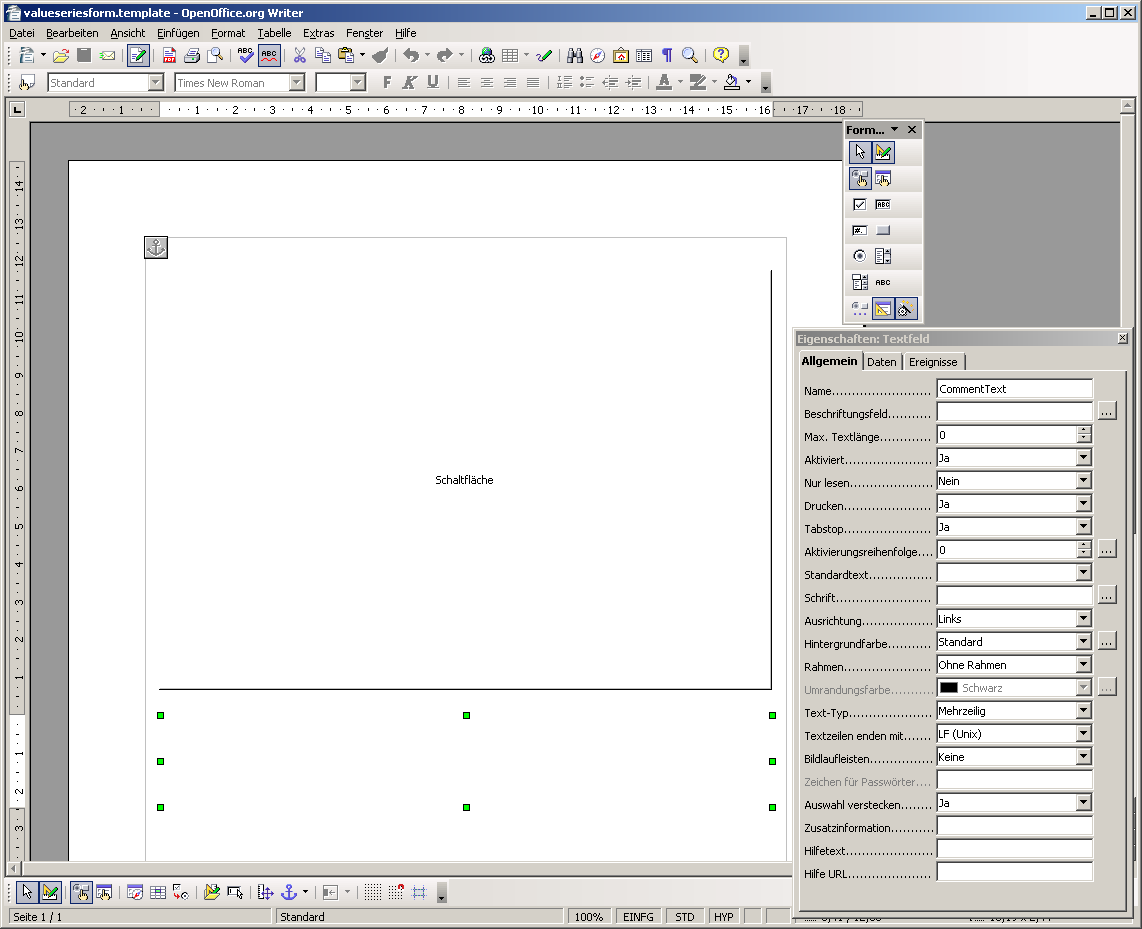
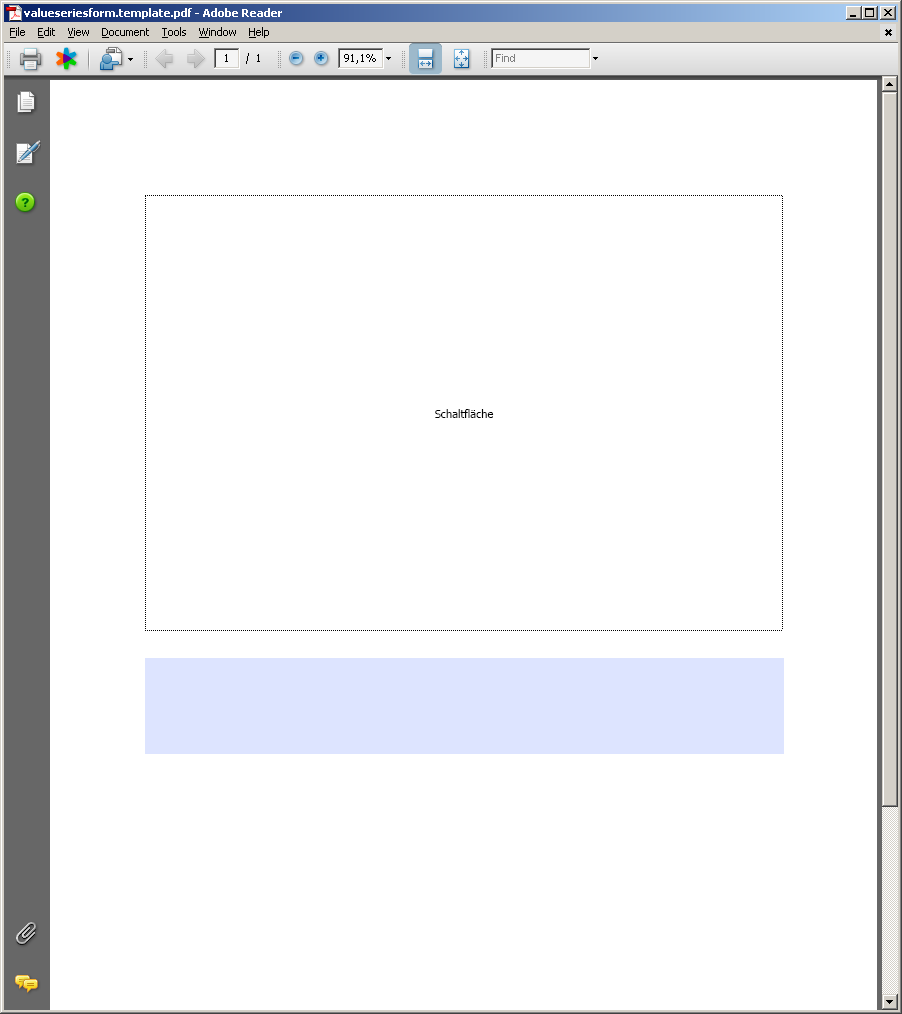
Nach der Lektüre von iText in Action zur Pdf-Erzeugung und -Manipulation und der Suche nach einem Werkzeug, mit dem man einfach und bequem Acroforms erzeugen kann kristallisierte sich eine neue, extrem leichtgewichtige Lösung für das Reporting-Problem heraus: OpenOffice und iText. Carl Young beschreibt in seinem Blog die Benutzung von OpenOffice als Designwerkzeug für Acrobat Forms.OpenOffice Form

Solche Pdf-Formulare lassen sich relativ einfach mit iText ausfüllen und mit Bildern versehen und dann abspeichern.

Form in AcrobatFilled Form

Damit hat man eine pure Java-Lösung in der Software und ein mächtiges, plattformübergreifendes Designwerkzeug für die Reports.

Die augenscheinlichsten Vorteile dieser Lösung sind:

  • Reportvorlagen liegen in Pdf vor, sind somit von jedem einsehbar und kontrollierbar
  • Die Quellen für die Reportvorlagen können mit OpenOffice erstellt und geändert werden und einfach per Knopfdruck als Pdf exportiert werden
  • Die Reportdaten können in beliebigen Formaten abgelegt oder im Programm generiert werden und dann mithilfe von iText in das Pdf-Formular übertragen werden

Die bisher festgestellten Nachteile sind je nach Einsatzzweck vernachlässigbar, können aber auch zum Showstopper werden:

  • Man muss immer feste Bereiche für die Daten festlegen, sind diese zu groß, werden sie wahlweise skaliert oder abgeschnitten (geht sowohl mit Bildern als auch mit Text!). Hat man also einen langen Fließtext und der Platz im Formularfeld reicht nicht aus, so hat man ein ziemliches Problem.
  • Man bekommt kein Format für die Formulardaten selbst geschenkt, sondern muss sich selbst um deren Speicherung kümmern, um den selben Report zu einem späteren Zeitpunkt neu zu erstellen oder die Reportdaten zur weiteren Verarbeitung bereitstellen zu können. Die programmatische Extraktion der Reportdaten aus dem fertigen Pdf-Report ist extrem aufwändig bis unmöglich.

Die bisherigen Erfahrungen mit dieser OpenOffice+iText-Lösung sind sehr positiv und helfen auch sehr bei der Kommunikation mit dem Kunden. In manchen Fällen fühlt sich dieser aufgrund der Textverarbeitung sogar in der Lage, selbst Layoutänderung auszuprobieren und durchzuführen. Selbst ungeschickte Entwickler bekommen durch OpenOffice mit vergleichsweise geringem Einarbeitungsaufwand ansehnliche Reports hin oder können die Sekretärin damit beauftragen. Kostenlos ist die ganze Lösung noch dazu.