Today I stumbled upon some behavior in C#’s List<> that I found very surprising. I had forgotten about RemoveAll() and basically implemented it myself:
var target = 0;
foreach (var each in list)
{
if (!predicate(each))
list[target++] = each;
}
list.RemoveRange(target, list.Count - target);
Apparently, this is not allowed. You cannot assign to any element in the List<> while you are iterating/enumerating it: The List<> implementation holds a ‘version’ number that is incremented any time a change is made, including assignments. When the Enumerator is advanced via MoveNext it checks for this version and throws the dreaded ‘Collection was modified’ exception.
Except that there shouldn’t really be a problem here, and the modification checking code is basically being too coarse. This code ‘compacts’ the list, copying elements where the predicate evaluates to true to the front of the list, and then cutting off the rest of the elements. There’s never really any doubt what each references. In fact, in other languages, this approach is even considered idiomatic to remove elements while iterating. In ancient C++, this is known as the remove/erase idiom, see also std::erase.
So why did the library designers of C# consider setting a value while iterating a problem? I don’t know, but at least now I have a story to remind of of RemoveAll()‘s existence.
A couple of weeks ago, I ported my game You Are Circle to the browser using Emscripten. Using the conan EMSDK toolchain, this was surprisingly easy to do. The largest engineering effort went into turning the “procedurally generate the level” background thread into a coroutine that I could execute in the main thread while showing the loading screen, since threads are not super well supported (and require enabling a beta feature on itch.io). I already had a renderer abstraction targeting OpenGL 4.1, which is roughly on feature parity with OpenGL ES 3.0, which is what you see WebGL2 as from Emscripten. And that just worked out of the box and things were fine for a while. Until they weren’t.
60FPS to 2FPS
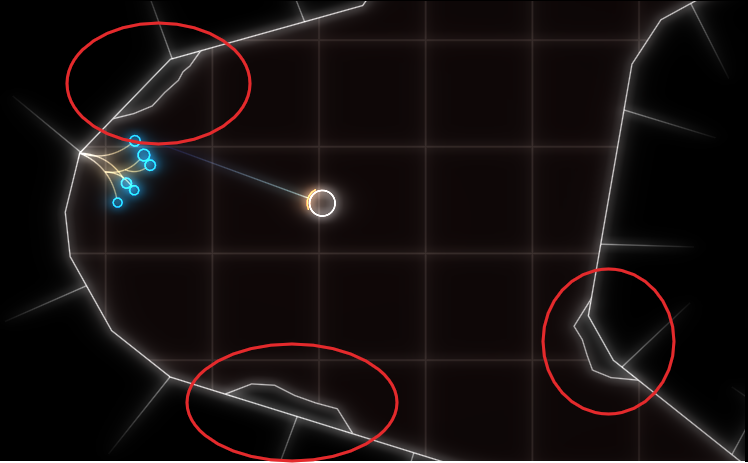
Last week I finally released a new feature: breakable rocks. These are attached to the level walls and can be destroyed for power-ups. I tested this on my machine and everything seemed to be working fine. But some people soon started complaining about unplayable performance in the web build, in the range of 1-2 FPS, coming from a smooth 60 FPS on the same machine. So I took out my laptop and tested it there, and lo and behold, it was very slow indeed. On chrome, even the background music was stuttering. I did some other ‘optimization’ work in that patch, but after ruling that out as the culprit via bisection, I quickly narrowed it down to the rendering of the new breakable rocks.
The rocks are circled in red in this screenshot:
As you can see, everything is very low-poly. The rocks are rendered in two parts, a black background hiding the normal level background and the white outline. If I removed the background rendering, everything was fine (except for the ‘transparent’ rocks).
Now it’s important to know that the rendering is all but optimized at this point. I often use the most basic thing given my infrastructure that I can get away with until I see a problem. In this case, I have some thingies internally that let me draw in a pretty immediate mode way: Just upload the geometry to the GPU and render it. Every frame. At the moment, I do this with almost all the geometry, visible or not, every frame. That was fast enough, and makes it trivial to change what’s being rendered when the rock is broken. The white outline is actually more geometry generated by my line mesher than the rock-background. But that was not causing any catastrophic slow-downs, while the background was. So what was the difference? The line geometry was batched on the CPU, while I was issuing a separate draw-call for each of those rocks. To give some numbers: there were about 100 of those rocks, with each of with up to 11 triangles.
Suspecting the draw call overhead, I tried batching, e.g. merging, all the rock geometry into a single mesh and rendering it with a single draw call. That seemed to work well enough. And that is the version currently released.
Deep Dive
But the problem kept nagging at me after I released the fix. Yes, draw calls can have a lot of overhead, especially in Emscripten. But going from 60FPS to 2FPS still seemed pretty steep, and I did not fully understand why it was so extremely bad. After trying Firefox’s Gecko Profiler, which was recommended in the Emscripten docs, I finally got an idea what was causing the problem. The graphics thread was indeed very busy, and showing a lot of time in MaxForRange<>. That profiler is actually pretty cool, and you can jump directly into the Firefox source code from there to get an idea what’s going on.
Geometry is often specified via one level of indirection: The actual ‘per Point’- a.k.a. Vertex-Array and a list of indices pointing into that, with each triplet defining a triangle. This is a form of compression, and can also help the CPU avoid duplicate work by caching. But it also means that the indices can be invalid, e.g. there can be out-of-bounds indices. And browsers cannot allow that fore safety reasons, so they check the validity before actually issuing a rendering command on the GPU. MaxForRange<> is part of the machinery to do just that via its caller GetIndexedFetchMaxVert. It determines the max index of a section of an index buffer. When issuing a draw call, that max-index is checked against the size of the per-point-data to avoid out-of-range accesses.
This employs a caching scheme: For a given range in the indices, the result is cached, so it doesn’t have to be evaluated again for repeated calls on the same buffer. Also, I suspect to make this cache ‘hit’ more often, the max-index is first retrieved for the whole of the current index buffer, and only if that cannot guarantee valid access, is the subrange even checked. See the calls to GetIndexedFetchMaxVert in WebGLContext::DrawElementsInstanced. When something in the index list is changed from the user side, this cache is completely evicted.
The way that I stream my geometry data in my renderer is by using “big” (=4mb) per-frame buffers for vertex and index data that I gradually fill in some kind of emulated “immediate mode”. In the specific instance for the rocks, this looks like this:
for (auto& each : rock)
{
auto vertex_source = per_frame_buffer.transfer_vertex_data(each.vertex_data);
auto index_source = per_frame_buffer.transfer_index_data(each.index_data);
device.draw(vertex_source, index_source, ...);
}
The combination of all that turned out to be deadly for performance, and again shows why caching is one of the two hard things in IT. The code essentially becomes:
for (auto& each : rock)
{
auto vertex_source = per_frame_buffer.transfer_vertex_data(each.vertex_data);
invalidate_per_frame_index_buffer_cache();
auto index_source = per_frame_buffer.transfer_index_data(each.index_data);
So for my 100 or so small rocks, the whole loop went through about 400mb of extra data per frame, or ~24gb per second. That’s quite something.
That also explains why merging the geometry helped, as it drastically reduced the amount of cache invalidations/refills. But now that the problem was understood, another option became apparent. Reorder the streamed buffer updates and draw calls, so that all the updates happen before all the draw calls.
Open questions
I am still not sure what the optimal way to stream geometry in WebGL is, but I suspect reordering the updates/draws and keeping the index buffer as small as possible might prove useful. So if you have any proven idea, I’d love to hear it.
I am also not entirely sure why I did not notice this catastrophic slow-down on my developer machine. I suspect it’s just because my CPU has big L2 and L3 caches that made the extra index scans very fast. I suspect I will see the performance problem in the profiler.
Back before C++11, the recommended way to customize the behavior of an algorithm was to write a functor-struct, e.g. a small struct overloading operator(). E.g. for sorting by a specific key:
Of course, the same logic could be implemented with a free function, but that was often advised against because it was harder for the compiler to inline. Either way, if you had to supply some context variables, you were stuck with the verbose functor struct anyways. And it made it even more verbose. Something like this was common:
That all changed, of course, when lambdas were added to the language, and you could write the same thing as:
auto indirect_less = [&](T const& lhs, T const& rhs)
  { return indirection[lhs.key] < indirection[rhs.key]; };
At least as long as the indirection std::vector<> is in the local scope. But what if you wanted to reuse some more complicated functors in different contexts? In that case, I often found myself reverting back to the old struct pattern. Until recently I discovered there’s a lot nicer way, and I ask myself how I missed that for so long: functor factories. E.g.
auto make_indirect_less(std::vector const& indirection) {
  return [&](T const& lhs, T const& rhs) { /* ... */ };
}
Much better than the struct! This has been possible since C++14’s return type deduction, so a pretty long time. Still, I do not think I have come across this pattern before. What about you?
Having a single source of truth is one of the big tenets of programming. It is easy to see why. If you want to figure out something about your program, or change something, you just go to the corresponding source.
One of the consequences of this is usually code duplication, but things can get a lot more complicated very fast, when you think of knowledge duplication or fragmentation, instead of just code. Quite unintuitively, duplication can actually help in this case.
Consider the case where you serialize an enum value, e.g. to a database or a file. Suddenly, you have two conceptual points that ‘know’ about the translation of your enum literals to a numeric or string value: The mapping in your code and the mapping implicitly stored in the serialization. None of these two points can be changed independently. Changing the serialized content means changing the source code and vice-versa.
You could still consider your initial enum to value mapping the single source of truth, but the problem is that you can easily miss disruptive changes. E.g. if you used the numeric value, just reordering the enumerated will break the serialization. If you used the text name of the enum, even a simple rename refactoring will break it.
So to deal with this, I often build my own single source of truth: a unit test that keeps track of such implicit value couplings. That way, the test can tell you when you are accidentally breaking things. Effectively, this means duplicating the knowledge of the mapping to a ‘safe’ space: One that must be deliberately changed, and resists accidentally being broken. And then that becomes my new single source of truth for that mapping.
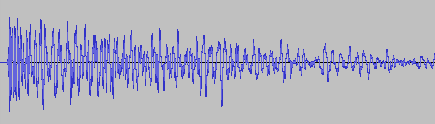
A couple of weeks ago, I asked my brother to test out my new game You Are Circle (please wishlist it and check out the demo, if that’s up your alley!) and among lots of other valuable feedback, he mentioned that the explosion sound effects had a weird click sound at the end that he could only hear with his headphones on. For those of you not familiar with audio signal processing, those click or pop sounds usually appear when the ‘curvy’ audio signal is abruptly cut off1. I did not notice it on my setup, but he has a lot of experience with audio mixing, so I trusted his hearing. Immediately, I looked at the source files in audacity:
They looked fine, really. The sound slowly fades out, which is the exact thing you need to do to prevent clicks & pops. Suspecting the problem might be on the playback side of his particular setup, I asked him to record the sound on his computer the next time he tested and then kind of forgot about it for a bit.
Fast-forward a couple of days. Neither of us had followed up on the little clicky noise thing. While doing some video captures with OBS, I noticed that the sound was kind of terrible in some places, the explosions in particular. Maybe that was related?
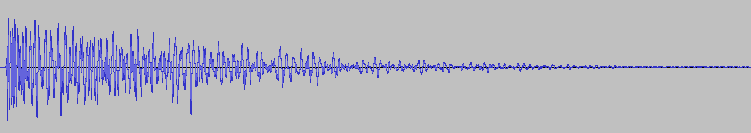
While building a new version of my game, Compiling resources... showed up in my console and it suddenly dawned on me: What if my home-brew resource compiler somehow broke the audio files? I use it to encode all the .wav originals into Ogg Vorbis for deployment. Maybe a badly configured encoding setup caused the weird audio in OBS and for my brother? So I looked at the corresponding .ogg files, and to my surprise, it indeed had a small abrupt cut-off at the end. How could that happen? Only when I put both the original and the processed file next to each other, did I see what was actually going on:
It’s only half the file! How did that happen? And what made this specific file so special for it to happen? This is one of many files that I also convert from stereo to mono in preprocessing. So I hypothesized that might be the problem. No way I missed all of those files being cut in half though, or did I? So I checked the other files that were converted from stereo to mono. Apparently, I did miss it. They were all cut in half. So I took a look at the code. It looked something like this:
while (keep_encoding)
{
  auto samples_in_block = std::min(BLOCK_SIZE, input.sample_count() - sample_offset);
  if (samples_in_block != 0)
  {
    auto samples_per_channel = samples_in_block / channel_count;
    auto channel_buffer = vorbis_analysis_buffer(&dsp_state, BLOCK_SIZE);
    auto input_samples = input.samples() + sample_offset;

    if (convert_to_mono)
    {
      for (int sample = 0; sample < samples_in_block; sample += 2)
      {
        int sample_in_channel = sample / channel_count;
        channel_buffer[0][sample_in_channel] = (input_samples[sample] + input_samples[sample + 1]) / (2.f * 32768.f);
      }
    }
    else
    {
      for (int sample = 0; sample < samples_in_block; ++sample)
      {
        int channel = sample % channel_count;
        int sample_in_channel = sample / channel_count;
        channel_buffer[channel][sample_in_channel] = input_samples[sample] / 32768.f;
      }
    }

    vorbis_analysis_wrote(&dsp_state, samples_per_channel);
    sample_offset += samples_in_block;
  }
  else
  {
    vorbis_analysis_wrote(&dsp_state, 0);
  }

  /* more stuff to encode the block using the ogg/vorbis API... */
}
Not my best work, as far as clarity and deep nesting goes. After staring at it for a while, I couldn’t really figure out what was wrong with it. So I built a small test program to debug into, and only then did I see what was wrong.
It was terminating the loop after half the file, which now seems pretty obvious given the outcome. But why? Turns out it wasn’t the convert_to_mono at all, but the whole loop. What’s really the problem here is mismatched and imprecise terminology.
What is a sample? The audio signal is usually sampled several thousand times (44.1kHz, 48kHz or 96kHz are common) per second to record the audio waves. One data point is called a sample. But that is only enough of a definition if the sound has a single channel. But all those with convert_to_mono==true were stereo, and that’s exactly were the confusion is in this code. One part of the code thinks in single-channel samples, i.e. a single sampling time-point has two samples in a stereo file, while the other part things in multi-channel samples, i.e. a single sampling time-point has only one stereo sample, that consists of multiple numbers. Specifically this line:
auto samples_in_block = std::min(BLOCK_SIZE, input.sample_count() - sample_offset);
samples_in_block and sample_offset use the former definition, while input.sample_count() uses the latter. The fix was simple: replace input.sample_count() with input.sample_count() * channel_count.
But that meant all my stereo sounds, even the longer music files, were missing the latter half. And this was not a new bug. The code was in there since the very beginning of the git history. I just didn’t hear its effects. For the sound files, many of them have a pretty long fade out in the second half, so I can kind of get why it was not obvious. But the music was pretty surprising. My game music loops, and apparently, it also loops if you cut it in half. I did not notice.
So what did I learn from this? Many of my assumptions while hunting down this bug were wrong:
My brother’s setup did not have anything to do with it.
Just because the original source file looked fine, I thought the file I was playing back was good as well.
The bad audio in OBS did not have anything to do with this, it was just recorded too loud.
The ogg/vorbis encoding was not badly configured.
The convert_to_mono switch or the special averaging code did not cause the problem.
I thought I would have noticed that almost all my sounds were broken for almost two years. But I did not.
What really cause the problem was an old programming nemesis, famously one of the two hard things in computer science: Naming things. There you have it. Domain language is hard.
I think this is because this sudden signal drop equates to a ‘burst’ in the frequency domain, but that is just an educated guess. If you know, please do tell. ↩︎
Today I was struggling with a relatively simple task in Visual Studio 2022: pass a file path in my source code folder to my running application. I am, as usual, using VS’s CMake mode, but also using conan 2.x and hence CMake presets. That last part is relevant, because apparently, it changes the way that .vs/launch.vs.json gets its data for macro support.
To make things a little more concrete, take a look at this, non-working, .vs/launch.vs.json:
Now I want MY_SOURCE_FOLDER in the env section there to reference my actual source folder. Ideally, you’d use something like ${sourceDir}, but VS 2022 was quick to tell me that it failed evaluation for that variable.
I did, however, find an indirect way to get access to that variable. The sparse documentation really only hints at that, but you can actually access ${sourceDir} in the CMake presets, e.g. CMakeUsersPresets.json or CMakePresets.json. You can then put it in an environment variable that you can access in .vs/launch.vs.json. Like this in your preset:
One code construct I encounter every now and then is what my colleague appropriately dubbed “the extranged child”, after I said that I do not have a proper name for it. It happens in OOP when a parent object creates child objects, and then later needs to interact with that child:
class Child { /* ... */ }

class Parent
{
  Child Create() { /* ... */ }
  void InteractWith(Child c) { /* ... */ }
}
This is all good, but as soon as inheritance enters the picture, it becomes more complicated:
abstract class BaseChild { /* ... */ }
abstract class BaseParent
{
  public abstract BaseChild Create();
  public abstract void InteractWith(BaseChild child);
}

class RealChild : BaseChild { }
class RealParent : BaseParent
{
  public override BaseChild Create()
  {
    return new RealChild( /* ... */ );
  }

  public override void InteractWith(BaseChild child)
  {
    // We really want RealChild here...
    var realChild = child as RealChild;
  }
}
The interaction often needs details that only the child type associated with that specific parent type has, so that involves a smelly downcast at that point.
One possible solution is adding a precondition for the InteractWith function. Something along the lines of “May only be called with own children”. That works, but cannot be checked by a compiler.
Another solution is to move the InteractWith function into the child, because at the point when it is created, it can know its real parent. That may not be the natural place for the function to go. Also, it requires the child to keep a reference to its parent, effectively making it a compound. But this approach can usually be done, as long as the relation of ‘valid’ child/parent types is one to one.
If you have a parent object that can create different kinds of children that it later needs to interact with, that approach is usually doomed as well. E.g. let the parent be a graphics API like OpenGL or DirectX, and the children be the resources created, like textures or buffers. For drawing, both are required later. At that point, really only the precondition approach works.
On the implementation side, the “ugly” casts remain. Stand-ins for the children can be used and associated with the data via dictionaries, hash-tables or any other lookup. This approach is often coupled with using (possibly strongly typed) IDs as the stand-ins. However, that really only replaces the downcast with a lookup, and it will also fail if the precondition is not satisfied.
Have you encountered this pattern before? Do you have a different name for it? Any thoughts on designing clean APIs that have such a parent-child relationship in a hierarchy? Let me know!
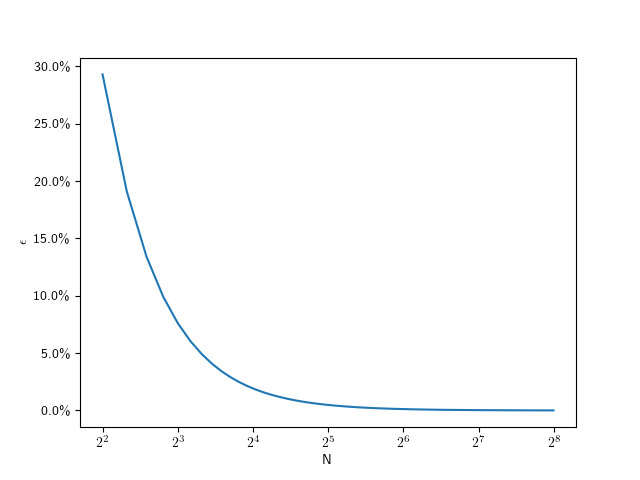
A common way to draw circles with any kind of vector graphics API is by approximating it with a regular polygon, e.g. as a regular polygon with 32 sides. The problem with this approach is that it might look good in one resolution, but crude in another, as the approximation becomes more visible. So how do you pick the right number of sides for the job? For that, let’s look at the error that this approximation has.
A whole bunch of math
I define the ‘error’ of the approximation as the maximum difference between the ideal circle shape and the approximation. In other words, it’s the difference of the inner radius and the outer radius of the regular polygon. Conveniently, with a step angle the inner radius is just the outer radius multiplied by the cosine of half of that: . So the error is . I find it convenient to use relative error for the following, and set :
The following plot shows that value for going from 4 to 256:
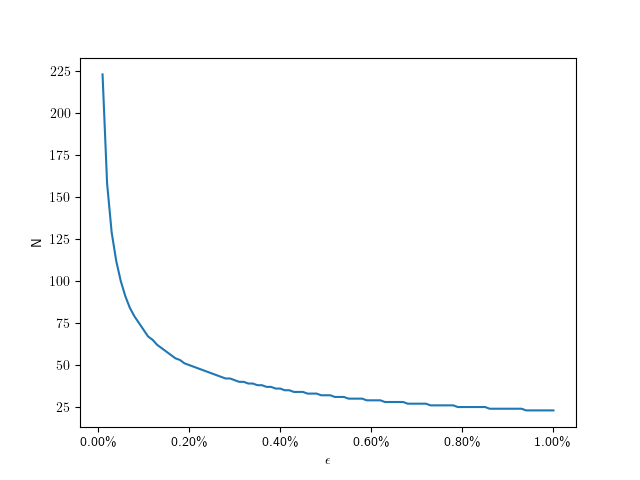
As you can see, this looks hyperbolic and the error falls off rather fast with an increasing number of subdivisions. This function lets use figure out the error for a given number of subdivisions, but what we really want is he inverse of that: Which number of subdivisions do we need for the error to be less than a given value. For example, assuming a 1080p screen, and a half-pixel error on a full-size () circle, that means we should aim for a relative error of . So we can solve the error equation above for N. Since the number of subdivisions should be an integer, we round it up:
So for we need only 71 divisions. The following plot shows the number of subdivisions for error values from to :
Here are some specific values:
0.01%
223
0.1%
71
0.2%
50
0.4%
36
0.6%
29
0.8%
25
1.0%
23
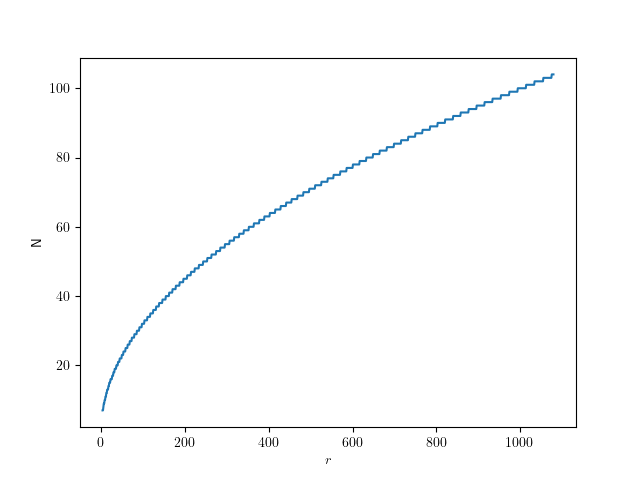
Assuming a fixed half-pixel error, we can plug in to get:
The following graph shows that function for radii up to full-size QHD circles:
Give me code
Here’s the corresponding code in C++, if you just want to figure out the number of segments for a given radius:
CMake has an option, CMAKE_UNITY_BUILD, to automatically turn your builds into unity-builds, which is essentially combining multiple source files into one. This is supposed to make your builds more efficient. You can just enable enable it while executing the configuration step of your CMake builds, so it is really easy to test. It might just work without any problems. Here are some examples with actual numbers of what that does with build times.
Project A
Let us first start with a relatively small project. It is a real project we have been developing, that reads sensor data, transports it over the network and displays it using SDL and Dear ImGui. I’m compiling it with Visual Studio (v17.13.6) in CMake folder mode, using build insights to track the actual time used. For each configuration, I’m doing a clean rebuild 3 times. The steps are the number of build statements that ninja runs.
Unity Build
#Steps
Time 1
Time 2
Time 3
OFF
40
13.3s
13.4s
13.6s
ON
28
10.9s
10.7s
9.7s
That’s a nice, but not massive, speedup of 124,3% for the median times.
Project A*
Project A has a relatively high number of non-compile steps: 1 step is code generation, 6 steps are static library linking, and 7 steps are executable linking. That’s a total of 14 non-compile steps, which are not directly affected by switching to unity builds. 5 of the executables in Project A are non-essential, basically little test programs. So in an effort to decrease the relative number of non-compile steps, I disabled those for the next test. Each of those also came with an additional source file, so the total number of steps decreased by 10. This really only decreased the relative amount of non-compile steps from 35% to 30%, but the numbers changes quite a bit:
Unity Build
#Steps
Time 1
Time 2
Time 3
OFF
30
9.9s
10.0s
9.7s
ON
18
9.0s
8.8s
9.1s
Now the speedup for the median times was only 110%.
Project B
Project B is another real project, but much bigger than Project A, and much slower to compile. It’s a hardware orchestration system with a web interface. As the project size increases, the chance for something breaking when enabling unity builds also increases. In no particular order:
Include guards really have to be there, even if that particular header was not previously included multiple times
Object files will get a lot bigger, requiring /bigobj to be enabled
Globally scoped symbols will name-clash across files. This is especially true for static globals or things in unnamed namespaces, which basically don’t do their job anymore. More subtly, things moved into the global namespace will also clash, such as the classes with the same name moved into the global namespace via using namespace.
In general, that last point will require the most work to resolve. If all fails, you can disable unity build on a target via set_target_properties(the_target PROPERTIES UNITY_BUILD OFF) or even just skip specific files for unity build inclusion via SKIP_UNITY_BUILD_INCLUSION. In Project B, I only had to do this for files generated by CMakeRC. Here are the results:
Unity Build
#Steps
Time 1
Time 2
Time 3
OFF
416
279.4s
279.3s
284,0s
ON
118
73.2s
76.6s
74.5s
That’s a massive speedup of 375%, just for enabling a build-time switch.
When to use this
Once your project has a certain size, I’d say definitely use this on your CI pipeline, especially if you’re not doing incremental builds. It’s not just time, but also energy saved. And faster feedback cycles are always great. Enabling it on developer machines is another matter: it can be quite confusing when the files you’re editing do not correspond to what the build system is building. Also, developers usually do more incremental builds where the advantages are not as high. I’ve also used hybrid approaches where I enable unity builds only for code that doesn’t change that often, and I’m quite satisfied with that. Definitely add an option to turn that off for debugging though. Have you had similar experiences with unity builds? Do tell!
The excellent {fmt} largely served as the blueprint for the C++20 standard formatting library. That alone speaks for its quality. But I was curious: should you now just use std::format for everything, or is fmt::format still a good option? In this particular instance, I wanted to know which one is faster, so I wrote a small benchmark. Of course, the outcome very much depends on the standard library you are using. In my case, I’m using Visual Studio 17.13.0 and its standard library, and {fmt} version 11.1.3.
I started with a benchmark helper function:
template <std::invocable<> F> steady_clock::duration benchmark(std::string_view label, F f)
{
  auto start = steady_clock::now();
  f();
  auto end = steady_clock::now();
  auto time = end - start;
  auto us = duration_cast<nanoseconds>(time).count() / 1000.0;
  std::cout << std::format("{0} took {1:.3f}us", label, us) << std::endl;
  return time;
}
Then I called it with a lambda like this, with NUMBER_OF_ITERATIONS set to 500000:
int integer = 567800;
float real = 1234.0089f;
for (std::size_t i = 0; i < NUMBER_OF_ITERATIONS; ++i)
  auto _ = fmt::format("an int: {}, and a float: {}", integer, real);
… and the same thing with std::format.
Interestingly, fmt::format only needed about 75%-80% of time of std::format in a release build, while the situation reversed for a debug build to about 106%-108%.
It seems hard to construct a benchmark with low overhead of other things, while still avoiding that the compiler can optimize everything away. My code assumes the compiler keeps the formatting even after throwing it away. So take all my results with a grain of salt!


 for the job? For that, let’s look at the error that this approximation has.
 the inner radius is just the outer radius
  multiplied by the cosine of half of that:
  . So the error is
  . I find it convenient to use relative error
  for the following, and set
  :
:
 ) circle, that means we should aim for a relative error of
  . So we can solve the error equation above for N. Since the number of subdivisions should be an integer, we round it up:
 to
to  :
:
 to get: