Spicing up the Game of Life Kata – Part I

Conway’s Game of Life is a worthwhile coding kata that I’ve implemented probably hundreds of times. It is compact enough to be completed in 45 minutes, complex enough to benefit from Test First or Test Driven Development and still maintains a low entry barrier so that you can implement it in a foreign programming language without much of a struggle (except if the foreign language is APL).

And despite appearing to be a simple 0-player game with just a few rules, it can yield to deep theory, as John Conway explains nicely in this video. Oh, and it is turing complete, so you can replicate a Game of Life in Game of Life – of course.

But after a few dozen iterations on the kata, I decided to introduce some extra aspects to the challenge – with sometimes surprising results. This blog series talks about the additional requirements and what I learnt from them.

Additional requirement #1: Add color to the game

The low effort user interface of the Game of Life is a character-based console output of the game field for each generation. It is sufficient to prove that the game runs correctly and to watch some of the more advanced patterns form and evolve. But it is rather unpleasing to the human eye.

What if each living cell in the game is not only alive, but also has a color? The first generation on the game field will be very gaudy, but maybe we can think about “color inheritance” and have the reproducing cells define the color of their children. In theory, this should create areas of different colors that can be tracked back to a few or even just one ancestor.

Let’s think about it for a moment: When all parent cells are red, the child should be red, too. If a parent is yellow and another one is red, the child should have a color “on the spectrum” between yellow and red.

Learning about inheritance rules

One specific problem of reproduction in the Game of Life is that we don’t have two parents, we always have three of them:

Any dead cell with exactly three live neighbors becomes a live cell, as if by reproduction.

Rule #4 of Game of Life

We need to think about a color inheritance rule that incorporates three source colors and produces a target color that is somehow related to all three of them:

f(c1, c2, c3) → cn

A non-harebrained implementation of the function f is surprisingly difficult to come up with if you stay within your comfort zone regarding the representation of colors in programming languages. Typically, we represent colors in the RGB schema, with a number for the three color ingredients: red, green and blue. If the numbers range from zero to one (using floating-point values) or from zero to 255 (using integer values) or even some other value range doesn’t really matter here. Implementing the color inheritance function using RGB colors adds so many intricacies to the original problem that I consider this approach a mistake.

Learning about color representations

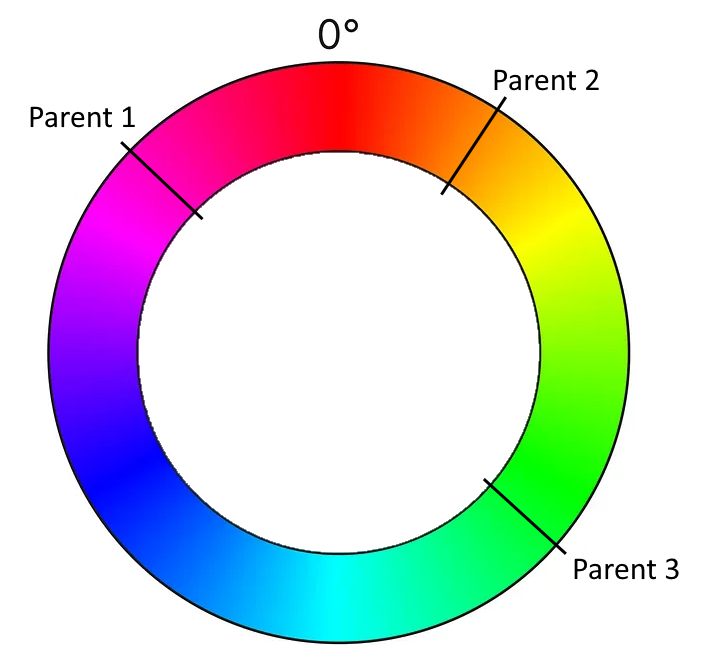
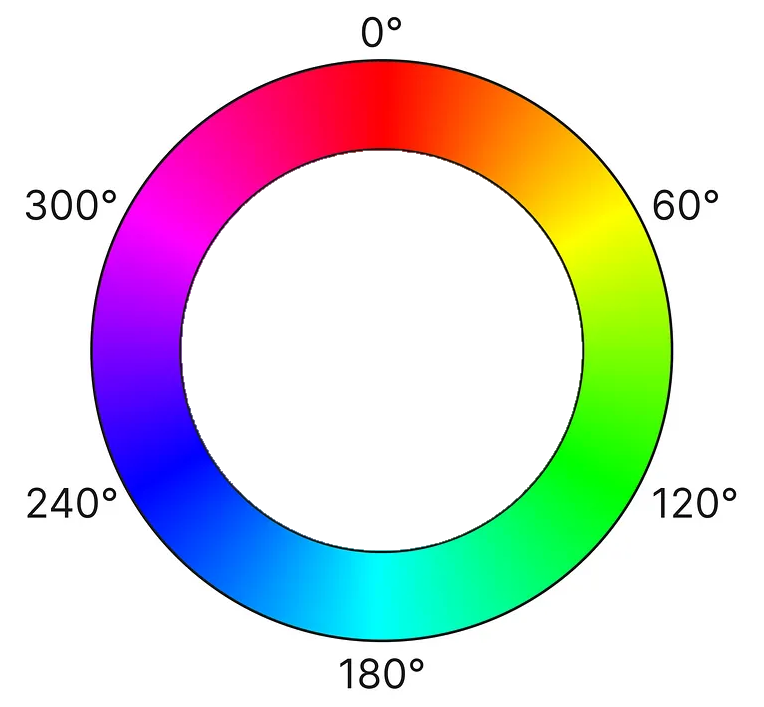
When we search around for alternative color representations, the “hue, saturation and brightness” or HSB approach might capture your interest. The interesting part is the first parameter: hue. It is a value between 0 and 360, with 0 and 360 being identically and meaning “red”. 360 is also the number of degrees in a full circle, so this color representation effectively describes a “color wheel” with one number.

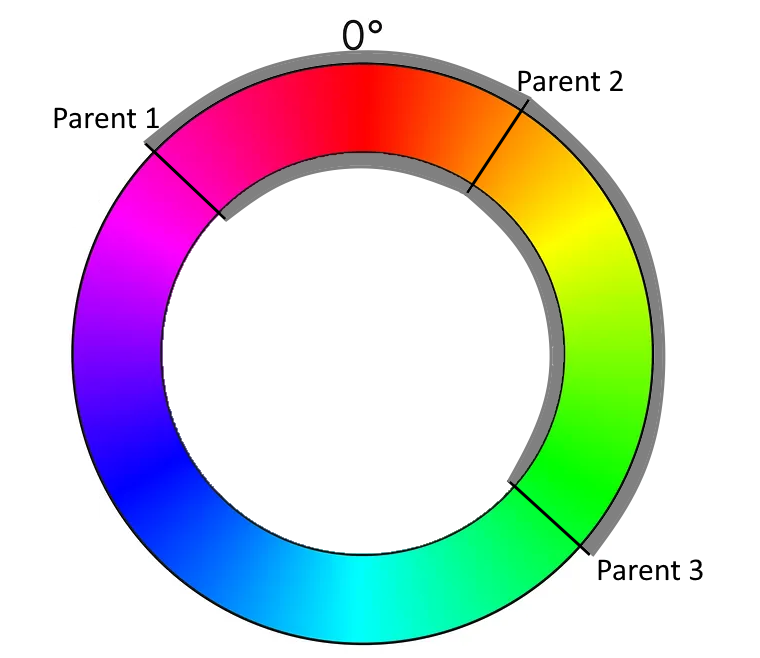
This means that for our color inheritance function, the parameters c1, c2 and c3 are degrees beween 0 and 360. The whole input might look like this:

Just by looking at the graphics, you can probably already see the color spectrum that is suitable for the function’s result. Instead of complicated color calculations, we pick an angle somewhere between two angles (with the third angle defining the direction).

And this means that we have transformed our color calculation into a geometric formula using angles. We can now calculate the span between the “leftmost” and the “rightmost” angle that covers the “middle” angle. We determine a random angle in this span and use it as the color of the new cell.

Learning about implicit coupling

But there are three possibilities to calculate the span! Depending on what angle you assign the “middle” role, there are three spans that you can choose from. If you just take your parent cells in the order that is given by your data structure, you implement your algorithm in a manner that is implicitly coupled to your technical representation. Once you change the data structure ever so slightly (for example by updating your framework version), it might produce a different result regarding the colors for the exact same initial position of the game. That is a typical effect for hardware-tied software, as the first computer games were, but also a sign of poor abstraction and planning. If you are interested in exploring the effects of hardware implications, the game TIS-100 might be for you.

We want our implementation to be less coupled to hardware or data structures, so we define that we use the smallest span for our color calculation. That means that our available colors will rapidly drift towards a uniform color for every given isolated population on our game field.

Learning about long-term effects (drifts)

But that is not our only concern regarding drifts. Even if you calculate your color span correctly, you can still mess up the actual color pick without noticing it. The best indicator of this long-term effect is when every game you run ends in the green/cyan/blue-ish region of the color wheel (the 50 % area). This probably means that you didn’t implement the equivalence of 0° and 360° correctly. Or, in other words, that your color wheel isn’t a wheel, but a value range from 0 to 360, but without wrap-around:

You can easily write a test case that takes the wrap-around into account.

But there are other drifts that might effect your color outcomes and those are not as easily testable. One source of drift might be your random number generator. Every time you pick a random angle from your span, any small tendency of the random number generator influences your long-term results. I really don’t know how to test against these effects.

A more specific source of drift is your usage of the span (or interval). Is it closed (including the endpoints) or open (not including the endpoints)? Both options are possible and don’t introduce drift. But what if the interval is half-open? The most common mistake is to make it left-closed and right-open. This makes your colors drift “counter-clockwise”, but because you wrapped them correctly, you don’t notice from looking at the colors only.

I like to think about possible test cases and test strategies that uncover those mistakes. One “fun” approach is the “extreme values random number generator” that only returns the lowest or highest possible number.

Conclusion

Adding just one additional concept to a given coding kata opens up a multitude of questions and learnings. If you add inheritable colorization to your Game of Life, it not only looks cooler, but it also teaches you about how a problem can be solved easier with a suitable representation, given that you look out for typical pitfalls in the implementation.

Writing (unit) test cases for those pitfalls is one of my current kata training areas. Maybe you have an idea how to test against drifts? Write a comment or even a full blogpost about it! I would love to hear from you.

How to Lay a Minefield

… in Minesweeper, of course.

One of the basic building blocks of my hands-on software development workshops are Coding Katas. Minesweeper, the classic game that every Microsoft Windows user knows since 1992, is one of the “medium everything” Katas: Medium scope, medium complexity, medium demand. One advantage is that virtually nobody needs any more explanation than “program a Minesweeper”.

The first milestone when programming a Minesweeper game is to lay the mines on the field in a random fashion. And to my continual surprise, this seems to be a hard task for most participants. Not hard in the sense of giving up, but hard in the sense that the solution lacks suitability or even correctness.

So in order to have a reference point I can use in future workshops and to discuss the usual approaches, here is how you lay a minefield in an adequate way.

The task is to fill a grid of tiles or cells with a predefined amount of mines. Let’s say you have a grid of ten rows and ten columns and want to place ten mines randomly.

Spoiler alert: If you want to think about this problem on your own, don’t read any further and develop your solution first!

Task analysis

If you pause for a moment and think about the ingredients that you need for the task, you’ll find three things:

  • A die (in the form of a random number generator)
  • An amount of mines to place (maybe just represented by a counter variable)
  • An amount of tiles (stored in a data structure)

Each solution I’ll present uses one of these things as the primary focus of interest. My language for this effect is that the solution “takes the thing into the hands”, while the other two things “lay on the table”. That’s because if you simulate how the solution works with real objects like paper and dice, you’ll really have one thing in your hands and the others on the table most of the time.

Solution #1: The probability approach

One way to think about the task of placing 10 mines somewhere on 100 tiles is to calculate the probability of a mine being on a tile and just roll the dice for every tile.

Here’s some code that shows how this approach might look like in Java:

private static final int fieldWidth = 10;
private static final int fieldHeigth = 10;

public static Set<Point> placeMinesOn(Set<Point> field) {
	Random rng = new Random();
	final double probability = 0.1D;
	for (int column = 0; column < fieldWidth; column++) {
		for (int row = 0; row < fieldHeigth; row++) {
			if (rng.nextDouble() < probability) {
				field.add(new Point(row, column));
			}
		}
	}
	return field;
}

Before we discuss the effects of this code, let’s have a little talk about the data structure that I use for the tiles:

The most common approach to model a two-dimensional grid of tiles in software is to use a two-dimensional array. There is nothing wrong with it, it’s just not the most practical approach. In reality, it is really cumbersome compared to its alternatives (yes, there are several). My approach is to separate the aspect of “two-dimensionalness” from my data structure. That’s why I use a set of points. The set (like a HashSet) is a one-dimensional data structure that more or less can only say “yes, I know this point” or “no, I never heard of this point”. To determine if a certain point (or tile at this coordinate) contains a mine, it just needs to be included in the set. An empty set represents an empty field. If you remove “cleared” mines from the set, its size is the number of remaining mines. With a two-dimensional array, you probably write several loop-in-loop structures, one of them just to count non-cleared mines.

Ok, now back to the solution. It is the approach that holds the die in the hands and uses it for every tile. The problem with it is that our customer didn’t ask for a probability of 10 percent for a mine, he/she asked for 10 mines. And the code above might place 10 mines, or 9, or 11, or even 14. In fact, the code places somewhere between 0 and 100 mines on the field.

The one thing this solution has going for it is the guaranteed runtime. We roll the dice 100 times and that’s it.

So we can categorize this solution as follows:

  • Correctness: not guaranteed
  • Runtime: guaranteed

If I were the customer, I would reject the solution because it doesn’t produce the outcome I require. A minesweeper contest based on this code would end in a riot.

Solution #2: Sampling with replacement

If you don’t take up the die, but the mines and try to dispense them on the field, you implement our second solution. As long as you have mines on hand, you choose a field at random and place it there. The only exception is that you can’t place a mine above a mine, so you have to check for the presence of a mine first.

Here’s the code for this solution in Java:

public static Set<Point> placeMinesOn(Set<Point> field) {
	Random rng = new Random();
	int remainingMines = 10;
	while (remainingMines > 0) {
		Point randomTile = new Point(
			rng.nextInt(fieldHeigth),
			rng.nextInt(fieldWidth)
		);
		if (field.contains(randomTile)) {
			continue;
		}
		field.add(randomTile);
		remainingMines--;
	}
	return field;
}

This solution works better than the previous one for the correctness category. There will always be 10 mines on the field once we are finished. The problem is that we can’t guarantee that we are able to place the mines in time before our player gets bored. Taking it to the extreme means that this code might run forever, especially if your random number generator isn’t up to standards.

So, the participants of your minesweeper contest might not protest the arbitrary number of mines on their field, but maybe just because they don’t know yet that they’ll always get 10 mines dispersed.

  • Correctness: guaranteed
  • Runtime: not guaranteed

This solution will probably work alright in reality. I just don’t see the need to utilize it when there is a clearly superior solution at hands.

Solution #3: Sampling without replacement

So far, we picked up the die and the mines. But what if we pick up the tiles? That’s the third solution. In short, we but all tiles in a bag and pick one by random. We place a mine there and don’t put it back into the bag. After we’ve picked 10 tiles and placed 10 mines, we solved the problem.

Here’s code that implements this solution in Java:

public static Set<Point> placeMinesOn(Set<Point> field) {
	List<Point> allTiles = new LinkedList<Point>();
	for (int column = 0; column < fieldWidth; column++) {
		for (int row = 0; row < fieldHeigth; row++) {
			allTiles.add(new Point(row, column));
		}
	}
	
	Collections.shuffle(allTiles);
	
	int mines = 10;
	for (int i = 0; i < mines; i++) {
		Point tile = allTiles.remove(0);
		field.add(tile);
	}
	return field;
}

The cool thing about this solution is that it excels in both correctness and runtime. Maybe we use some additional memory for our bag and some runtime for the shuffling, but both can be predefined to an upper limit.

Yet, I rarely see this solution in my workshops. It’s only after I challenge their first solution that people come up with it. I’m biased, of course, because I’ve seen too many approaches (successful and failed) and thought about the problem way longer than usual. But you, my reader, are probably an impartial mind on this topic and can give some thoughts in the comments. I would appreciate it!

So, let’s categorize this approach:

  • Correctness: guaranteed
  • Runtime: guaranteed

If I were the customer, this would be my anticipation. My minesweeper contest would go unchallenged as long as nobody finds a flaw in the shuffle algorithm.

Summary

It is suprisingly hard to solve simple tasks like “distribute N elements on a X*Y grid” in an adequate way. My approach to deconstruct and analyze these tasks is to visualize myself doing them “in reality”. This is how I come up with the “thing in hands” metaphor that help me to imagine new solutions. I hope this helps you sometimes in the future.

How do you lay a minefield and how do you find your solutions? Write a blog post or leave a comment!

Discount UX

Creating a better user experience does not need to be expensive, you don’t need fancy tools like eye tracking or facial expression detection to make a difference. Here are some tools I use to get a better understanding of what users need.

Creating a better user experience does not need to be expensive, you don’t need fancy tools like eye tracking or facial expression detection to make a difference. Here are some tools I use to get a better understanding of what users need.

Sketching

The universal tool to communicate besides words are sketches. Whether I draw an idea for a user interface, use a state diagram to discuss transitions or draw boxes and arrows to show connections, sketches at the heart of everyday working and thinking. What you need for this? Paper and a pencil.

Observation

In order to understand a human using your system you not only need to talk to him but you have to observe him doing his work. This is not just playing the fly on the wall. These sessions are interactive in nature, resulting in a back and forth. The user shows you how he works, you ask questions, he goes into more detail, you wonder about certain points, he explain his reasoning (or sometimes has wonders himself). Again paper and pencil is great. Having the option to take screenshots or (permission provided) a photo is even better. The most crucial is an open mind. You need to go in with a beginner’s mind: do not assume anything and wonder about almost everything.

Card sort

Observation is a pretty direct way to learn about the user doing his work. But even then some part of the mental model is hidden. To dig deeper into what kind of concepts and words he uses and how these are interrelated, a card sorting session can be helpful. Together with him we draw those words onto cards and let him sort them into groups and give them priorities. Here often discussions arise about the exact words you write on the paper. Some words need to be in more than one group, two different words mean the same, another word means something different in a different context. Here you also can take a glimpse at (sub-)domain bounds. Again cards, a pencil and paper to take notes is all you need.

Design studio or crazy 8

Sketching is so helpful you can do it even in a group. If you need to brainstorm for a user interface you take a sheet of paper and divide into 8 sections. Then you draw 8 very simple sketchy version of the UI in 8 – 16 minutes. After that you evaluate them in the group against your goals. The first round produces divergent sketches after seeing each other drawings, you will see that the next round converges into a common direction. You probably guessed it already: paper and a pencil is all you need.

Paper Journey Mapping

The last one in this group is more of an analyzing and communicating results tool. A journey map is a way to show the user (his thoughts, feelings and actions) along the steps he takes in his daily work. This map can highlight different aspects of your findings: the many applications he has to use to get his job done, the critical parts which mostly affect his mood, the frustrations, the many points for failure, the different people involved and so on. A large (DIN A3 or bigger) piece of paper is helpful and different colors of pencils help to highlight aspects.

Summary

All these methods use (almost only) pen and paper but are very helpful in getting to a better user understanding and therefore a better user experience. What are your tools for understanding?
If you have any questions or need more details please feel free to comment. I am at the starting point of the user experience journey and like to learn from others.

Getting better at programming without coding

Almost two decades ago one of the programming books was published that had a big impact on my thinking as a software engineer: the pragmatic programmer. Most of the tips and practices are still fundamental to my work. If you haven’t read it, give it a try.
Over the years I refined some practices and began to get a renewed focus on additional topics. One of the most important topics of the original tips and of my profession is to care and think about my craft.
In this post I collected a list of tips and practices which helped and still help me in my daily work.

Think about production

Since I develop software to be used, thinking early about the production environment is key.

Deploy as early as possible
Deployment should be a non event. Create an automatic deployment process to keep it that way and deploy as early as possible to remove the risk from unpleasant surprises.

Master should always be deployable
Whether you use master or another branch, you need a branch which could always be deployed without risk.

Self containment
Package (as many as possible of) your dependencies into your deployment. Keep the surprises of missing repositories or dependencies to a minimum of none.

Use real data in development
Real data has characteristics, gaps and inconsistencies you cannot imagine. During development use real data to experience problems before they get into production.

No data loss
Deploying should not result in a loss of data. Your application should shutdown gracefully. Often deployment deletes the directory or uses a fresh place. No files or state in memory should be used as persistence by the application. Applications should be stateless processes.

Rollback
If anything goes wrong or the new deployed application has a serious bug you need to revert it to the last version. Make rollback a requirement.

No user interruption
Users work with your application. Even if they do not lose data or their current work when you deploy, they do not like surprises.

Separate one off tasks
Software should be running and available to the user. Do not delay startup with one off admin tasks like migration, cache warm-up or search index creation. Make your application start in seconds.

Manage your runs
Problems, performance degradation and bugs should be visible. Monitor your key metrics, log important things and detect problems in the application’s data. Make it easy to combine, search and graph your recordings.

Make it easy to reproduce
When a bug occurs or your user has a problem, you need to follow the steps how the system arrived at its current state. Store their actions so that they can be easily replayed.

Think about users

Software is used by people. In order to craft successful applications I have to consider what these people need.

No requirements, just jobs
Users use the software to get stuff done. Features and requirements confuse solutions with problems. Understand in what situation the user is and what he needs to get to his goal. This is the job you need to support.

Work with the user
In order to help the user with your software I need to relate to his situation. Observing, listening, talking to and working along him helps you see his struggles and where software can help.

Speak their language
Users think and speak in their domain. Not in the domain of software. When you want to help them, you and the user interface of your software needs to speak like a user, not like a software.

Value does not come from effort
The most important things your software does are not the ones which need the most effort. Your users value things which help them the most. Find these.

Think about modeling

A model is at the core of your software. Every system has a state. How you divide and manage this state is crucial to evolving and understanding your creation.

Use the language of the domain
In your core you model concepts from the user’s domain. Name them accordingly and reasoning about them and with the users is easier.

Everything has one purpose
Divide your model by the purpose of its parts.

Separate read from write
You won’t get the model right from the start. It is easier to evolve the model if read and write operations have their own model. You can even have different read models for different use cases. (see also CQRS and Turning the database inside out)

Different parts evolve at different speeds
Not all parts of a model are equal. Some stand still, some change frequently. Some are specified, about some others you learn step by step. Some need to be constant, some need to be experimented with. Separating parts by its changing speed will help you deal with change.

Favor immutability
State is hard. State is needed. Isolating state helps you understand a running system. Isolating state helps you remove coupling.

Keep it small
Reasoning about a large system is complicated. Keep effects at bay and models small. Separating and isolating things gives you a chance to overview the whole system.

Think about approaches

Getting to all this is a journey.

When thinking use all three dimensions
Constraining yourself to a computer screen for thinking deprives you of one of your best thinking tools: spatial reasoning. Use whiteboards, walls, paper and more to remove the boundaries from your thoughts.

Crazy 8
Usually you think in your old ways. Getting out of your (mental) box is not easy. Crazy 8 is a method to create 8 solutions (sketches for UI) in a very short time frame.

Suspend judgement
As a programmer you are fast to assess proposals and solutions. Don’t do that. Learn to suspend your judgement. Some good ideas are not so obvious, you will kill them with your judgement.

Get out
Thinking long and hard about a problem can put you into blindfold mode. After stating the problem, get out. Take a walk. Do not actively think or talk about the problem. This simulates the “shower effect”: getting the best ideas when you do not actively think about the problem.

Assume nothing
Assumptions bear risks. They can make your project fail. Approach your project with what is certain. Choose your direction to explore and find your assumptions. Each assumption is an obstacle, an question that needs an answer. Ask your users. Design hypotheses and experiments to proof them. (see From agile to UX for a detailed approach)

Pre-mortem
Another way to find blind spots in your thinking is to frame for failure. Construct a scenario in which your project is failed. Then reason about what made it fail. Where are your biggest risks? (see How to map your fears for details)

MVA – Minimum, valuable action
Every step, every experiment should be as lightweight as possible. Do not craft a beautiful prototype if a sketch would suffice. Choose the most efficient method to get further to your goal.

Put it into a time box
When you need to experiment, constrain it. Define a time in which you want to have an answer. You do not need to go the whole way to get an impression.

A small example of domain analysis

One thing I’ve learned a lot about in recent years is domain analysis and domain modeling. Every once in a while, an isolated piece of code or a separable concept shows me just how much I’ve missed out all the years before. A few weeks ago, I came across such an example and want to share the experience and insight. It’s a story about domain exploration with heightened degree of difficulty – another programmer had analyzed it before and written code that I should replace. But first, let’s talk about the domain.

The domain

04250The project consisted of a machine control software that receives commands and alters the state of a complex electronic circuitry accordingly. The circuitry consists of several digital-to-analog converters (DAC), among other parts. We will concentrate on the DACs in this story. In case you don’t know what a DAC is, let me explain. Imagine a little integrated circuit (IC), the black bug-like electronic parts on a circuit board. On one side, you provide it a digital number in binary representation and on the other side, you’ll get an analog voltage that represents your number. Let’s say you drive a 8-bit DAC and give it a digital zero, the output will be zero volt. If you give the same DAC the number 255, it will output the maximum possible voltage. This voltage is given by the “reference voltage” pin and is usually tied to 5 V in traditional TTL logic circuits. If you drive a 12-bit DAC, the zero will still yield 0 V, while the 255 will now only yield about 0,3 V because the maximum digital number is now 4095. So the resolution of a DAC, given in bits, is a big deal for the driver.

DAC0800How exactly you have to provide that digital number, what additional signals need to be set or cleared to really get the analog voltage is up to the specific type of DAC. So this is the part of behaviour that should be encapsulated inside a DAC class. The rest of the software should only be able to change the digital number using a method on a particular DAC object. That’s our modeling task.

The original implementation

My job was not to develop the machine control software from scratch, but re-engineer it from existing sources. The code is written in plain C by an electronics technician, and it really shows. For our DAC driver, there was a function that took one argument – an integer value that will be written to the DAC. If the client code was lazy enough to not check the bounds of the DAC, you would see all kinds of overflow effects. It worked, but only if the client code knew about the resolution of the DAC and checked the bounds. One task the machine control software needed to do was to translate the command parameters that were given in millivolts to the correct integer number to feed it into the DAC and receive the desired millivolts at the analog output pin. This calculation, albeit not very complicated, was duplicated all over the place.


writeDAC(int value);

My original translation

One primary aspect when doing re-engineering work is not to assume too much and don’t change too many places at once. So my first translation was a method on the DAC objects requiring the exact integer value that should be written. The method would internally check for the valid value range because the object knows about the DAC resolution, while the client code should subsequently lose this knowledge. The original code translated nicely to this new structure and worked correctly, but I wasn’t happy with it. To provide the correct integer value, the client code needs to know about the DAC resolution and perform the calculation from millivolts to DAC value. Even if you centralize the calculation, there are still calls from everywhere to it.


dac.write(int value);

My first relevation

When I finally had translated all existing code, I knew that every single call to the DAC got their parameter in millivolts, but needed to set the DAC integer. Now I knew that the client code never cared about DAC integers at all, it cared about millivolts. If you find such a revelation, act on it – even just to see where it might lead you to. I acted and replaced the integer parameter of the write method on the DAC object with a voltage parameter. I created the Voltage domain type and had it expose factory methods to be easily created from millivolts that were represented by integers in the commands that the machine control software received. Now the client code only needed to create a Voltage object and pass it to the DAC to have that voltage show up at the analog output pin. The whole calculation and checking part happened inside the DAC object, where it belongs.


dac.write(Voltage required);

This version of the code was easy to read, easy to reason about and worked like a charm. It went into production and could be the end of the story.

The second insight

But the customer had other plans. He replaced parts of the original circuitry and upgraded most of the DACs on the way. Now there was only one type of DAC, but with additional amplifier functionality for some output pins (a typical DAC has several output pins that can be controlled by a pin address that is provided alongside the digital number). The code needed to drive the DACs, that were bound to 5 V reference voltage, but some channels would be amplified to double the voltage, providing a voltage range from 0 V to 10 V. If you want to set one of those channels to 5 V output voltage, you need to write half the maximum number to it. If the DAC has 12-bit resolution, you need to write 2047 (or 2048, depending on your rounding strategy) to it. Writing 4095 would yield 10 V on those channels.

Because the amplification isn’t part of the DAC itself, the DAC code shouldn’t know about it. This knowledge should be placed in a wrapper layer around the DAC objects, taking the voltage parameters from the client code and changing it according to the amplification of the channel. The client code would want to write 10 V, pass it to the wrapper layer that knows about the amplification and reduces it to 5 V, passing this to the DAC object that transforms it to the maximum reference voltage (5 V) that subsequently gets amplified to 10 V. This sounded so weird that I decided to review my domain analysis.

It dawned on me that the DAC domain never really cared about millivolts or voltages. Sure, the output will be a specific voltage, but it will be relative to your input in relation to the maximum value. The output voltage has the same percentage of the maximum value as the input value. It’s all about ratios. The DAC should always demand a percentage from the client code, not a voltage. This way, you can actually give it the ratio of anything and it will express this ratio as a voltage compared to the reference voltage. The DAC is defined by its core characteristics and the wrapper layer performs the translation from required voltage to percentage. In case of amplification, it is accounted for in this translation – the DAC never needs to know.


dac.write(Percentage required);

Expressiveness of the new concept

Now we can really describe in code what actually happens: A command arrives, requiring us to set a DAC channel to 8 volt. We create the voltage object for 8 volt and pass it on to the DAC wrapper layer. The layer knows about the 2x amplification and the reference voltage. It calculates that 8 volt will be 80% of the maximum DAC value (80% of 5 V being 4 V before and 8 V after amplification) and passes this information to the DAC object. The DAC object, being the only one to know its resolution, sets 0.8 * maximum_DAC_value to the required register and everything works.

The new concept of percentages decouples the voltage information from the DAC resolution information and keeps both informations where they belong. In fact, the DAC chip never really knows about the reference voltage, either – it’s the circuit around it that knows.

Conclusion

While it is easy to see why the first version with voltages as parameters has its charms, it isn’t modeling the reality accurately and therefor falls short when flexibility is required. The first version ties DAC resolution and reference voltage together when in fact the DAC chip only knows the resolution. You can operate the chip with any reference voltage within a valid range. By decoupling those informations and moving the knowledge about reference voltages outside the DAC object, I modeled the reality more accurate and every requirement finds its natural place. This “natural place finding” is what makes a good model useful for reasoning. In our case, the natural place for the reference voltage was outside the DAC in the wrapper layer. Finding a real name for the wrapper layer was easy, I called it “circuit board”.

Domain analysis is all about having the right abstractions for your model. Your model is suitable for your task when everything fits and falls into place nearly automatically. When names needn’t be found but kind of obtrude themselves from the real domain. The right model (for the given task) feels good and transports a lot of domain knowledge. And domain knowledge is the most treasurable knowledge for any developer.

Assumptions – how to find, track and eliminate them

Assumptions can kill a project. Like a house built on sand we don’t know when and where it will collapse.
The problem with assumptions is that they disguise as truths. We believe them.

Assumptions can kill a project. Like a house built on sand we don’t know when and where it will collapse.
The problem with assumptions is that they disguise as truths. We believe them. They are the project’s reality. Just like the matrix.
Assumptions are shortcuts. Guesses at reality. We cannot fully grasp reality, so we assume. But we can find evidence for our decisions. For this we need to uncover the assumptions, assess their risk and gather evidence. But how do we know what we assume?

Find assumptions

Watch your language

‘I think’, ‘In my opinion’, ‘should be’, ‘roughly’, ‘circa’ are all clues for assumptions. Decisions need to be based on evidence. When we use vague language or personal opinions to describe our project we need to pause. Under this lurks insecurity and assumptions.
Another red flag are metaphors. Metaphors might be great to present, paint a picture in our head or describe a vision. But in decision making they are too abstract and meaningless. We may use them to describe our strategy but when we need to design and implement we need borders that constrain our decisions. Metaphors usually cover only some aspects of the project and vice versa. There’s a mismatch. We need concrete language without ambiguity.

Be dumb

We know so much that we think others have the same experience, education, view point, familiarity, proficiency and imprinting. We know so little that we think the other way is also true. We transfer. We assume. Dare to ask dumb questions. Adopt a beginner’s mind. Challenge traditions and common beliefs.
We take age old decisions for granted. They were made by people smarter than us, so they must be right. Don’t do this. Question them. Even the obvious ones.
In the book ‘Hidden in plain sight’ Jan Chipchase enters a typical cafe where people sit and talk, drink coffee and typing on their laptops. The question he poses: should the coffeshop owner sell diapers? So that everybody can continue what they do without the need to go to the bathroom. This question challenges our cultural and imprinted beliefs. And this is good.

Be curious

Ask: why? We need to get to the root of the problem. Dig deeper. Often under layers of reasoning and thoughtful decisions lies an assumption. The chain is only so strong as its weakest link. If we started with an assumption, the reasoning building on it is also assumed. Children often ask why and don’t stop even when we think it is all said and logical. So when we find the root, we need to continue to ask: is this really the root? Why is it the way it is.
Another question we need to ask repeatedly is: what if? What if: our target audience changes? we try to follow the opposite of the goals of our project? what if the technology changes?

Change perspectives

We see what we want to see. Seeing is an active process. We can stretch our thinking only so far. To stretch it even further we need to change roles. For just some hours do the work our users do. Feel their pains. Their highs and lows.
Or adopt the role of the browser. Good interfaces are conversations. Play a dialog with your user. Be the browser.
Only by embracing constraints of other perspectives we can force ourselves to stretch. In this way we find things which are assumed by us because of our view of the world.

Track them

After we have collected the assumptions we need to track them to later prove or disprove them. For this a simple spreadsheet or table is sufficient. This learning plan consists of 5 columns (taken from Leah Buley’s The UX Team of one):

  • the assumption: what we believe is true
  • the certainty: a 3 or 5 point scale showing how sure we are that we are right
  • notes: additional notes of why we think the assumption is right or wrong
  • the evidence: results which we collected to support this assumption
  • the research: things we can do to collect further evidence

Eliminate them

Now that we know what we assume and with which certainty we think we are right, we can start to collect further information to support or disprove our claims. In short: We research. Research can take many different forms. But all forms are there to gain further insights. Some basic forms we use to bring light into the darkness of uncertainty are:

  • Stakeholder interviews
  • (Contextual) user interviews
  • Heuristic evaluation
  • Prototyping
  • Market research

Other methods we don’t use (yet) include:

  • A/B tests (paired with analytics)
  • User tests

The point behind all these methods is to build a chain of reasoning. Everything in our software needs a reason to exist. The users and the stakeholders are the primary sources of insight. But also our experience, the human psychology and common patterns or conventions help us to decide which way to go.
Not only the method of collecting is important but also how the results are documented. We should present the essential information in a way that it is easy to get a glimpse of it just by looking at the respective documents. On the other side we should all keep this pragmatic and not go overboard. Our goal is to get insight and not build a proof of the system.

Domain model design with food coupons

A recent customer requirement for the implementation of an application specified that every data-modifying user action has to be confirmed by the user through a confirmation prompt.
The application in question is a single page web application with client/server communication over an HTTP JSON API. The domain model is located on the server side, the client side is the user interface.

One option to accomplish the requirement could have been to implement the confirmation process exclusively on the client-side. The client code would show a confirmation dialog right before every HTTP POST, PUT, PATCH or DELETE request and perform the request only after confirmation. This would be fairly easy to implement. The downside of this approach is that the requirement is not reflected in the application’s domain model. The requirement however is so crucial that it should be part of the domain model, not just an implementation detail of the client user interface. So we opted for a different approach, which makes the confirmation process part of the domain model and exposes it through the HTTP API.

Coupon system

The basic idea is a coupon system, analogous to the ones that can be found at some food and beverage sales booths at festivals: you choose a food or drink item, pay for it at the pay booth and get a coupon. This coupon can be redeemd at a different booth where you receive the actual item.

coupon
Source: http://de.wikipedia.org/wiki/Verzehrbon | License: Public domain


Transferred to our web application the implementation looks like this: The client sends a request for an action to the server. But instead of performing the action immediately, the server stalls the action and responds with a unique confirmation token that identifies the waiting action. The client receives the token and can finally trigger the action by sending the confirmation token to a separate confirmation API endpoint. The server recognizes the pending user action based on the confirmation token and executes it. Of course, some care has to be taken that those pending actions, which are never confirmed time out after a while and that a malicious user can’t flood the server with waiting actions. The confirmation dialog can be triggered from the client-side code via an HTTP response interceptor that checks for a confirmation token in the response and opens the confirmation dialog if a token is present and hands the token to the confirmation endpoint if the user clicks “Ok”.

Conclusion

With this design the requirement is encoded in the server-side domain model and becomes apparent through the API. Any user of the API is called to attention by the guidance of its design. Of course, an implementor of a new client could choose to ignore the hint and return the token directly to the server without prompting the user for confirmation, but that would be a deliberate and conscious choice and not a mere oversight.

The power of analysis

A short story about the power of good analysis. Thinking in terms of the problem domain is a key ingredient.

Quite some years ago, I heard a story about the power of analysis that happened even deeper in the past. Its moral holds true until today, though. It’s the insight that to fully analyse a particular challenge or task, you have to think outside your own box. Let’s hear the story before we analyse it:

The problem

A small company for sensor technology usually solved customer problems like distance measurement without contact or gas mixture control. The team was informed about all the latest sensors and trained to come up with solutions even to really challenging tasks. This lead to a word of mouth recommendation for a new customer that promptly described his problem.

christmas-star-lamp-smallThe customer ran a workshop for physically handicapped people that mostly worked with wood and produced a wide variety of products that got sold on various markets. One product was the Christmas lamp in shape of a star. It proved to be a best-seller and had a good economic ratio. At least it could have, if only the rejects rate would be lower. To assemble the lamp from little wooden laths was difficult for skilled workers and even harder for skilled handicapped workers. The main difficulty was to glue the laths in just the right angle to result in the desired star shape. The customer needed some set-up of sensors that would indicate to the worker when the angle was right. He imagined something like a cheap navigation system that would yell/display “left” and “right” until the angle was “correct”.

The solution finding

The team accepted the task and started the creative solution process that lasted several days of thinking, doodling, researching and scribbling. Then, the team gathered for a solution finding session. A multitude of ideas were presented and almost instantly rejected. From laser distance measurement over acoustic ultrasonic sensors to camera-based image evaluation, everything cool and remotely feasible was presented and rejected because nothing had an even remote chance to succeed outside of laboratory settings. Not one approach survived the applicability check. The team was devastated and returned to the creative phase, if not as reckless as the first time.

The solution

A few days later, the second solution finding session had only a few new ideas, none standing a chance. Finally, a student spoke up: “This isn’t a problem that should be solved with sensors!”. Well, this was a bold sentence in a team of sensor technologists. The student explained: “The real problem is the placement of the small laths, not the correct angle itself. Even if we build a sensor that can reliably indicate right and wrong angles, it would just tell the worker that whatever he tries, he won’t get it right. These workers don’t need supervision, they need assistance. No sensor is going to deliver that.” The team was baffled. The student went on: “I thought about a solution that will assist the worker during the assembly, but it’s nothing we will get rich with. A simple mould in the right shape, perhaps non-adhering to the glue they use for the wood, would let them produce one half of the lamp. Glue two of those halves together and everything fits. No need for batteries even.”

christmas-lamp-star-sideWhen the sensor technology company proposed this solution to the customer, he laughed loud and long. It was the most elegant and inexpensive solution he never thought of. It was exactly what was needed. It worked perfectly from the first prototypes onward. The Christmas lamp rejects rate dwindled to almost zero instantly. In short: perfect score. Just that the sensor technology company wouldn’t earn anything with maintenance or improvements was a minor drawback.

Good analysis

This story is my illustrative material when I have to explain what good analysis is. Let’s take a look at the bafflement of the team: They had all started their solution finding with the premise that this was a problem inside their area of expertise. Even the customer said so. Good analysis works out the real nature of a problem regardless of what anybody says about it. This includes any description given by the customer or even the wood workers in charge of the actual work. Good analysis finds a solution that fits the problem, not the field of expertise of the analyst.

Analysis is the process of thinking in terms of the problem space. In this story, an important part of the analysis was already done by the customer: Most of the rejects have wrong angles, so we need to make sure the angles are correct and we need a machine to tell us, because apparently the workers themselves can’t. The machine needs sensors, so lets assign a sensor company on the task. This was the initial premise that nobody except the student questioned. And this was half of the analysis that nobody bothered to repeat. You cannot really understand the problem if you begin your thinking mid-flight.

Applying good analysis

It’s easy to tell a story (even if it really happened) and derive insights from it. It’s much harder to apply these insights in the own work. The crucial step is to fully understand the actual problem that should be solved (in the story: correct justification instead of correct angle). The next step is to incorporate the value system of the customer: if I alter some key characteristics of the solution, will it still serve the customer’s actual needs? In the story: A cheap aluminium mould serves the customer even better than some expensive fancy machine. The mould can be duplicated nearly infinitely, the machine probably not. The mould is grasped instantly, the machine needs instructions. The mould keeps working long after the machine ran out of battery. The mould assists, the machine merely scolds.

If, after thoroughly working on these two steps, the solution lies still inside your field of expertise, you can proceed to design the solution. You’ve just left the analysis process to concentrate on one possible solution. That’s all right, but remember to return to the earliest steps of analysis when you get stuck. Designing a solution for a falsely analysed premise almost always leads nowhere in the long run.