Recently I ran into a problem that only showed up outside the development environment.
I had a small script that needed to iterate over all records in the database and load blobs.
Document.all.eachdo |doc|
process(doc.blob)
end
With a small dataset everything worked as expected. With production-sized data, however, the job was terminated by the runtime with an out-of-memory error.
This behaviour is not surprising once you look at what all.each actually does.
How all.each works
When calling all.each ActiveRecord is loading the complete result set into memory before the iteration starts. For large tables this means that thousands or even millions of Ruby objects are instantiated at once.
If each record also references additional data — for example blobs, attachments, or associations — the memory usage grows quickly.
Loading Records with find_each
ActiveRecord provides find_each for exactly this scenario:
Document.find_eachdo |doc|
process(doc.blob)
end
In contrast to each, this method does not load all records at once. Instead, records are fetched in batches and yielded one by one.
Conceptually the process looks like this:
Load a limited number of records
Yield them to the block
Discard them
Load the next batch
By default, find_each loads records in batches of 1000. The batch size can be configured:
Document.find_each(batch_size:100) do |doc|
process(doc.blob)
end
find_each always iterates in primary key order. This means the model must have a primary key that is orderable like integer or string. Any explicit ordering will be ignored.
If more control is required, find_in_batches can be used instead. It requires manual iteration over the batches.
Conclusion
Iterating over large tables with all.each is easy to write but can lead to excessive memory usage once the dataset grows.
For batch processing tasks, find_each is usually the safer default because it limits the number of instantiated records and keeps memory usage predictable.
Today I stumbled upon some behavior in C#’s List<> that I found very surprising. I had forgotten about RemoveAll() and basically implemented it myself:
var target = 0;
foreach (var each in list)
{
if (!predicate(each))
list[target++] = each;
}
list.RemoveRange(target, list.Count - target);
Apparently, this is not allowed. You cannot assign to any element in the List<> while you are iterating/enumerating it: The List<> implementation holds a ‘version’ number that is incremented any time a change is made, including assignments. When the Enumerator is advanced via MoveNext it checks for this version and throws the dreaded ‘Collection was modified’ exception.
Except that there shouldn’t really be a problem here, and the modification checking code is basically being too coarse. This code ‘compacts’ the list, copying elements where the predicate evaluates to true to the front of the list, and then cutting off the rest of the elements. There’s never really any doubt what each references. In fact, in other languages, this approach is even considered idiomatic to remove elements while iterating. In ancient C++, this is known as the remove/erase idiom, see also std::erase.
So why did the library designers of C# consider setting a value while iterating a problem? I don’t know, but at least now I have a story to remind of of RemoveAll()‘s existence.
Writing software in Python often is a pleasure and can lead to great products with limited costs because of its expressiveness and rich ecosystem.
One area where imho Python falls a bit short is deployment and packaging. On Linux many users and customers expect packages for their platform so they can manage the software installation and updates using the standard tools.
This is where the pain often starts. Depending on the dependencies of your python project it may be simple or rather hard to provide a decent experience for the people managing your software.
I want to present several ways of providing a decent deployment experience to your customer specifically for Debian-based linux distributions.
The simple case
If all the dependencies of your project are available in usable versions for the target distribution, it is quite easy to package a python project as a .deb. My preferred way is to just use stdeb like below:
This will built a simple debian package installable on a matching destination platform. For simple cases this often is enough.
If only one or a few dependencies are missing, you could consider packaging them too using this approach and allowing your project to take this same route.
Not using packages at all
If some dependencies are not available on the target platform through Debian packages it may be easiest to just provide a tarball with an installation script. This script would essentially perform the following steps
Unpack the source to a nice destination directory
Create a venv there
Install the dependencies in the venv
Provide some startscript and/or service definition to launch the software using the venv
This is simple and usually scales to bigger projects but does not provide nice and clean integration into the system tools. Administrators have to manage the software this way and not the package manager way they may expect and be comfortable with.
A hybrid Debian package approach
My hybrid approach is a blend of the two above:
It builds a normal debian package containing the project itself along with version and dependency metadata. In the postinst-script of the package however, it creates a venv and installs the dependencies unavailable or unusable (e.g. wrong version) on the target platform.
This creates a debian/ directory containing all the packaging metadata files. You should mainly edit the control, copyright and changelog files and then craft the postinst file for our hybrid packaging approach:
#!/bin/sh

set -e

case "$1" in
    configure)
      python3 -m venv /opt/my-project/venv
      . /opt/my-project/venv/bin/activate && pip install PyQt5 pytango==9.5.1 taurus pyepics
    ;;

    abort-upgrade|abort-remove|abort-deconfigure)
    ;;

    *)
        echo "postinst called with unknown argument '$1'" >&2
        exit 1
    ;;
esac

exit 0
For correct removal we need a modified postrm script too:
#!/bin/sh

set -e

case "$1" in
    purge|remove|upgrade|failed-upgrade|abort-install|abort-upgrade|disappear)
      rm -rf /opt/my-project/venv/
    ;;

    *)
        echo "postrm called with unknown argument '$1'" >&2
        exit 1
    ;;
esac
exit 0
Using a final dpkg-buildpackage -b -us -uc we get a debian package that builds its own venv on the target machine using the dependencies we actually need and not what the system offers.
For us and our customers this is a perfect compromise:
It allows us to define the dependencies and their versions exactly and mostly independent from what the target system offers while coming as a normal debian package managed using system tools.
So, one of the biggest software developer joys is, when a customer, after you developed some software for them a few years back, is returning to you with change requests and it turns out that the reason you didn’t hear much from them was not complete abandonment of their project, or utter mistrust in your capabilites, or – you name it – but just that the software worked without any problems. It just did its job.
But one of the next biggest joys is, then, to actually experience how your software behaves after their staff – also just doing their job – growed their database up to a huge number of records and now you see your system under pressure, with all parts playing each other in large scales.
Now, with interactions like on-the-fly-updates during mouse gestures like drag’n’drop, falling behind real-time can be more than a minor nuisance; this might go against a core purpose of such a gesture. But how do you troubleshoot an application which is behaving smoothly most of the time, but then have very costly computations during short periods of time?
Naively, one would just put logging statements in every part that can possibly want to update, but this very quickly meets its limit when your interface just has so many components on display, and you can’t just check that one interaction on one singular part?
This is where I thought of this small device, which I now wanted to share. In my case, this was a React application, but we just use a single object, defined globally, which is modified by a single function like this
and I do feel compelled to emphasize that this completely goes outside the React way of thinking, taking care with every state to follow the framework-internal logic. Not some global object, i.e. shared memory that any component can modify at will. But while for production code, I would hardly advise doing so, our debugging profits from that ghostly setup of “every component just raises the I-was-updated-information to somewhere out of its realm”.
It just uses one global timeout, giving a short time frame during which every repeated function call of logBatched(...); raises one entry in the “seen” field of our global object; and when that collection period is over, you get one batched output containing all the information. And you can easily extend that by passing more information along, or maybe, replacing that seen: [] with a new Set() if registering multiple updates of the same component is not what you want. (Also, the timestamp is there just out of habit, it’s not magically required or so).
Note that you can do all additional processing of “how do I need to prepare my debugging statements in order to actually see who the real culprits are” after collecting, and done in an extra task, can even be as expensive as you want it to be without blocking your rendering. As in, having debugging code that significantly affects the actual problem that you are trying to understand, is especially probable in such real-time user interactions; which means you are prone to chasing phantoms.
I like this thing because of its simplicity, and particularly, because it employs a way of thinking that would instinctively make me doubt the qualification of anyone who would give me such a piece to review (😉) but for that specific use case, I’d say, does the job pretty well.
A couple of weeks ago, I ported my game You Are Circle to the browser using Emscripten. Using the conan EMSDK toolchain, this was surprisingly easy to do. The largest engineering effort went into turning the “procedurally generate the level” background thread into a coroutine that I could execute in the main thread while showing the loading screen, since threads are not super well supported (and require enabling a beta feature on itch.io). I already had a renderer abstraction targeting OpenGL 4.1, which is roughly on feature parity with OpenGL ES 3.0, which is what you see WebGL2 as from Emscripten. And that just worked out of the box and things were fine for a while. Until they weren’t.
60FPS to 2FPS
Last week I finally released a new feature: breakable rocks. These are attached to the level walls and can be destroyed for power-ups. I tested this on my machine and everything seemed to be working fine. But some people soon started complaining about unplayable performance in the web build, in the range of 1-2 FPS, coming from a smooth 60 FPS on the same machine. So I took out my laptop and tested it there, and lo and behold, it was very slow indeed. On chrome, even the background music was stuttering. I did some other ‘optimization’ work in that patch, but after ruling that out as the culprit via bisection, I quickly narrowed it down to the rendering of the new breakable rocks.
The rocks are circled in red in this screenshot:
As you can see, everything is very low-poly. The rocks are rendered in two parts, a black background hiding the normal level background and the white outline. If I removed the background rendering, everything was fine (except for the ‘transparent’ rocks).
Now it’s important to know that the rendering is all but optimized at this point. I often use the most basic thing given my infrastructure that I can get away with until I see a problem. In this case, I have some thingies internally that let me draw in a pretty immediate mode way: Just upload the geometry to the GPU and render it. Every frame. At the moment, I do this with almost all the geometry, visible or not, every frame. That was fast enough, and makes it trivial to change what’s being rendered when the rock is broken. The white outline is actually more geometry generated by my line mesher than the rock-background. But that was not causing any catastrophic slow-downs, while the background was. So what was the difference? The line geometry was batched on the CPU, while I was issuing a separate draw-call for each of those rocks. To give some numbers: there were about 100 of those rocks, with each of with up to 11 triangles.
Suspecting the draw call overhead, I tried batching, e.g. merging, all the rock geometry into a single mesh and rendering it with a single draw call. That seemed to work well enough. And that is the version currently released.
Deep Dive
But the problem kept nagging at me after I released the fix. Yes, draw calls can have a lot of overhead, especially in Emscripten. But going from 60FPS to 2FPS still seemed pretty steep, and I did not fully understand why it was so extremely bad. After trying Firefox’s Gecko Profiler, which was recommended in the Emscripten docs, I finally got an idea what was causing the problem. The graphics thread was indeed very busy, and showing a lot of time in MaxForRange<>. That profiler is actually pretty cool, and you can jump directly into the Firefox source code from there to get an idea what’s going on.
Geometry is often specified via one level of indirection: The actual ‘per Point’- a.k.a. Vertex-Array and a list of indices pointing into that, with each triplet defining a triangle. This is a form of compression, and can also help the CPU avoid duplicate work by caching. But it also means that the indices can be invalid, e.g. there can be out-of-bounds indices. And browsers cannot allow that fore safety reasons, so they check the validity before actually issuing a rendering command on the GPU. MaxForRange<> is part of the machinery to do just that via its caller GetIndexedFetchMaxVert. It determines the max index of a section of an index buffer. When issuing a draw call, that max-index is checked against the size of the per-point-data to avoid out-of-range accesses.
This employs a caching scheme: For a given range in the indices, the result is cached, so it doesn’t have to be evaluated again for repeated calls on the same buffer. Also, I suspect to make this cache ‘hit’ more often, the max-index is first retrieved for the whole of the current index buffer, and only if that cannot guarantee valid access, is the subrange even checked. See the calls to GetIndexedFetchMaxVert in WebGLContext::DrawElementsInstanced. When something in the index list is changed from the user side, this cache is completely evicted.
The way that I stream my geometry data in my renderer is by using “big” (=4mb) per-frame buffers for vertex and index data that I gradually fill in some kind of emulated “immediate mode”. In the specific instance for the rocks, this looks like this:
for (auto& each : rock)
{
auto vertex_source = per_frame_buffer.transfer_vertex_data(each.vertex_data);
auto index_source = per_frame_buffer.transfer_index_data(each.index_data);
device.draw(vertex_source, index_source, ...);
}
The combination of all that turned out to be deadly for performance, and again shows why caching is one of the two hard things in IT. The code essentially becomes:
for (auto& each : rock)
{
auto vertex_source = per_frame_buffer.transfer_vertex_data(each.vertex_data);
invalidate_per_frame_index_buffer_cache();
auto index_source = per_frame_buffer.transfer_index_data(each.index_data);
So for my 100 or so small rocks, the whole loop went through about 400mb of extra data per frame, or ~24gb per second. That’s quite something.
That also explains why merging the geometry helped, as it drastically reduced the amount of cache invalidations/refills. But now that the problem was understood, another option became apparent. Reorder the streamed buffer updates and draw calls, so that all the updates happen before all the draw calls.
Open questions
I am still not sure what the optimal way to stream geometry in WebGL is, but I suspect reordering the updates/draws and keeping the index buffer as small as possible might prove useful. So if you have any proven idea, I’d love to hear it.
I am also not entirely sure why I did not notice this catastrophic slow-down on my developer machine. I suspect it’s just because my CPU has big L2 and L3 caches that made the extra index scans very fast. I suspect I will see the performance problem in the profiler.
Once every while, I remember a public software engineering talk, held by Daniel and visited by me (not only), at a time before I accidentally started working for the Softwareschneiderei for several years, which turned out splendid – but I digress – and while the topic of that talk was (clearly) a culinary excursion about… how onions are superior to spaghetti… one side discussion spawned that quote (originally attributed to Michael Jackson e.g. here)
You know the First Rule of Optimization?
… don’t.
You know the Second Rule?
… don’t do it YET.
I like that a lot, because while we’ve all been at places where we knew a certain algorithm to be theoretically sub-optimal, measures of optimal is also “will it make my customer happy in a given time” and “will our programming resources be used at the most effective questions at hand”.
And that is especially tricky in software in which a customer starts with a wish like “I want a certain view on my data that I never had before” (thinking of spreadsheets, anyone?) and because they do not know what they will learn from that, no specification can even be thought-out. Call it “research” or “just horsing around”, but they will be thankful if you have a robust software that does the job, and customers can be very forgiving about speed issues, especially when they accumulate slowly over time.
Now we all know what N+1 query problems are (see e.g. Frederik’s post from some weeks ago), and even without databases, we are generally wary about any nested loops. But given the circumstances, one might write specific queries where you do allow yourself some.
There it not only “I have no time”. Sometimes you can produce much more readable code by doing nested queries. It can make sense. I mean, LINQ and the likes have a telling appearance, e.g. one can read
var plansForOffer = db.PlansFor(week).Where(p => p.Offers.Contains(offer.Id));
if (plansForOffer.Any()) {
  lastDay = plansForOffer.Max(p => p.ProposedDay);
}
surely quite well; but here alone do the .Any() and the .Max() loop over similar data needlesly, and probably the helper PlansFor(…) does something like it, and then run that in a loop over many “offers” and quickly, there goes your performance down the drain only because your customers have now 40 instead of 20 entities.
To cut a long story short – with given .NET and Entity Framework in place, and in the situation of now-the-customer-finds-it-odd-that-some-queries-take-seven-minutes-to-completion, I did some profiling. In software where there are few users and ideally one instance of the software on one dedicated machine, memory is not the issue. So I contrasted the readable, “agile” version with some queries at startup and converged at the following pattern
var allOffers = await db.Offers
    .Where(o => ... whatever interests you ... )
    .Include(o => ... whatever EF relations you need ...)
    .ToListAsync();
var allOfferIds = allOffsets
    .Select(o => o.Id)
    .ToArray();
var allPlans = await db.PlanningUnits
    .Where(p => p.Contains(offer.Id))
    .AsNoTracking()
    .ToListAsync();
var allPlanIds = allPlans
    .Select(p => p.Id)
    .ToArray();
var allAppointments = await db.Appointments
    .Where(a => allPlanIds.Contains(a.PlanId))
    .AsNoTracking()
    .ToListAsync();
var requiredSupervisors = allAppointments
    .Select(a => a.Supervisor)
    .Distinct()
    .ToArray();
var requiredRooms = await db.Rooms
    .Where(r => requiredSupervisors.Contains(r.SupervisorId)
    .AsNoTracking()
    .ToDictionaryAsync(r => r.Id);

// ...

return (
    allOffers
    .Select(o => CollectEverythingFromMemory(o, week, allOffers, allPlans, allAppointments, ...))
    .ToDictionary(o => o.Id);
);
So the patterns are
Collect every data pool that you will possibly query as completely as you need
Load it into memory as .ToList() and where you can – e.g. in a server application, use await … .ToListAsync() in order to ease the the request thread pool
With ID lists and subsequent .Contains(), the .ToArray() call is even enough as arrays come with less overhead – although this is less important here.
Use .ToDictionaryAsync() for constant-time lookups (although more modern .NET/EF versions might have advanced functions there, this is the more basic fallback that worked for me)
Also, note the .AsNoTracking() where you are querying the database only (if not mutating any of this data), so EF can save all the memory overhead.
With that pattern, all inner queries transform to quite efficient in-memory-filtering of appearance like
and while this greatly blew up function signatures, and also required some duplication because these inner functions are not as modular, as stand-alone anymore, our customers now enjoyed a reduction in query size of really
Before: ~ 7 Minutes
After: ~ half a second
i.e. a 840-fold increase in performance.
Conclusion: not regretting much
It is somewhat of a dilemma. The point of “optimization…? don’t!” in its formulation as First and Second Rule holds true. I would not have written the first version of the algorithm in that consolidated .ToList(), .ToArray()., ToDictionary() shape when still in a phase where the customer gets new ideas every few days. You will need code that is easier to change, and easier to reckon about.
By the way – cf. the source again – ,the Third Rule is “Profile Before Optimizing”. When dealing with performance, it’s always crucial to find the largest culprit first.
And then, know that there are general structures which make such queries efficient. I can apply these thoughts to other projects and probably do not have to finely dig into the exact details of other algorithms, I just need to make that trade-off above.
Back before C++11, the recommended way to customize the behavior of an algorithm was to write a functor-struct, e.g. a small struct overloading operator(). E.g. for sorting by a specific key:
Of course, the same logic could be implemented with a free function, but that was often advised against because it was harder for the compiler to inline. Either way, if you had to supply some context variables, you were stuck with the verbose functor struct anyways. And it made it even more verbose. Something like this was common:
That all changed, of course, when lambdas were added to the language, and you could write the same thing as:
auto indirect_less = [&](T const& lhs, T const& rhs)
  { return indirection[lhs.key] < indirection[rhs.key]; };
At least as long as the indirection std::vector<> is in the local scope. But what if you wanted to reuse some more complicated functors in different contexts? In that case, I often found myself reverting back to the old struct pattern. Until recently I discovered there’s a lot nicer way, and I ask myself how I missed that for so long: functor factories. E.g.
auto make_indirect_less(std::vector const& indirection) {
  return [&](T const& lhs, T const& rhs) { /* ... */ };
}
Much better than the struct! This has been possible since C++14’s return type deduction, so a pretty long time. Still, I do not think I have come across this pattern before. What about you?
When dividing decimal numbers in Java, some values—like 1 divided by 3—result in an infinite decimal expansion. In this blog post, I’ll show how such a calculation behaves using BigDecimal and BigFraction.
BigDecimal
Since this cannot be represented exactly in memory, performing such a division with BigDecimal without specifying a rounding mode leads to an “java.lang.ArithmeticException: Non-terminating decimal expansion; no exact representable decimal result”. Even when using MathContext.UNLIMITED or an effectively unlimited scale, the same exception is thrown, because Java still cannot produce a finite result.
BigDecimal a = new BigDecimal("1");
BigDecimal b = new BigDecimal("3");
BigDecimal c = a.divide(b);
By providing a scale – not MathContext.UNLIMITED – and a rounding mode, Java can approximate the result instead of failing. However, this also means the value is no longer mathematically exact. As shown in the second example, multiplying the rounded result back can introduce small inaccuracies due to the approximation.
BigDecimal a = new BigDecimal("1");
BigDecimal b = new BigDecimal("3");
BigDecimal c = a.divide(b, 100, RoundingMode.HALF_UP); // 0.3333333...
BigDecimal a2 = c.multiply(b);  // 0.9999999...
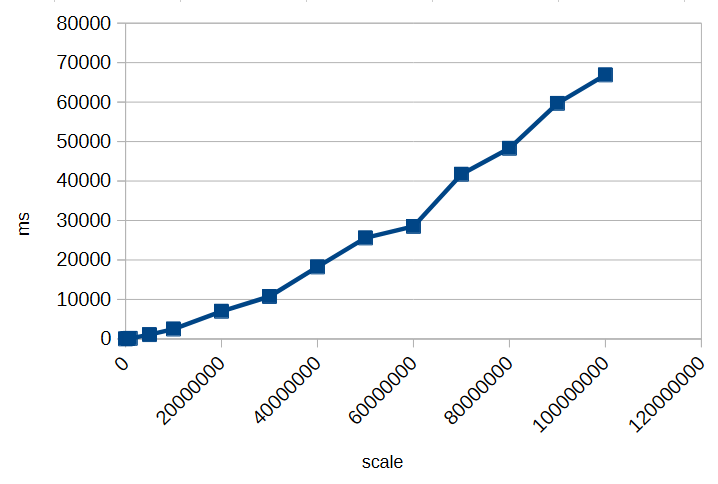
When working with BigDecimal, it’s important to think carefully about the scale you actually need. Every additional decimal place increases both computation time and memory usage, because BigDecimal stores each digit and carries out arithmetic with arbitrary precision.
To illustrate this, here’s a small timing test for calculating 1/3 with different scales:
As you can see, increasing the scale significantly impacts performance. Choosing an unnecessarily high scale can slow down calculations and consume more memory without providing meaningful benefits. Always select a scale that balances precision requirements with efficiency.
However, as we’ve seen, decimal types like BigDecimal can only approximate many numbers when their fractional part is infinite or very long. Even with rounding modes, repeated calculations can introduce small inaccuracies.
But how can you perform calculations exactly if decimal representations can’t be stored with infinite precision?
BigFraction
To achieve truly exact calculations without losing precision, you can use fractional representations instead of decimal numbers. The BigFraction class from Apache Commons Numbers stores values as a numerator and denominator, allowing it to represent numbers like 1/3 precisely, without rounding.
import org.apache.commons.numbers.fraction.BigFraction;

BigFraction a = BigFraction.ONE;
BigFraction b = BigFraction.of(3);
BigFraction c = a.divide(b);    // 1 / 3
BigFraction a2 = c.multiply(b); // 1
In this example, dividing 1 by 3 produces the exact fraction 1/3, and multiplying it by 3 returns exactly 1. Since no decimal expansion is involved, all operations remain mathematically accurate, making BigFraction a suitable choice when exact arithmetic is required.
BigFraction and Decimals
But what happens if you want to create a BigFraction from an existing decimal number?
At first glance, everything looks fine: you pass in a precise decimal value, BigFraction accepts it, and you get a fraction back. So far, so good. But if you look closely at the result, something unexpected happens—the number you get out is not the same as the one you put in. The difference is subtle, hiding far to the right of the decimal point—but it’s there. And there’s a simple reason for it: the constructor takes a double.
A double cannot represent most decimal numbers exactly. The moment your decimal value is passed into BigFraction.from(double), it is already approximated by the binary floating-point format of double. BigFraction then captures that approximation perfectly, but the damage has already been done.
Even worse: BigFraction offers no alternative constructor that accepts a BigDecimal directly. So whenever you start from a decimal number instead of integer-based fractions, you inevitably lose precision before BigFraction even gets involved. What makes this especially frustrating is that BigFraction exists precisely to allow exact arithmetic.
Creating a BigFraction from a BigDecimal correctly
To preserve exactness when converting a BigDecimal to a BigFraction, you cannot rely on BigFraction.from(double). Instead, you can use the unscaled value and scale of the BigDecimal directly:
In this case, BigFraction automatically reduces the fraction to its simplest form, storing it as short as possible. Even though the original numerator and denominator may be huge, BigFraction divides out common factors to minimize their size while preserving exactness.
BigFraction and Performance
Performing fractional or rational calculations in this exact manner can quickly consume enormous amounts of time and memory, especially when many operations generate very large numerators and denominators. Exact arithmetic should only be used when truly necessary, and computations should be minimized to avoid performance issues. For a deeper discussion, see The Great Rational Explosion.
Conclusion
When working with numbers in Java, both BigDecimal and BigFraction have their strengths and limitations. BigDecimal allows precise decimal arithmetic up to a chosen scale, but it cannot represent numbers with infinite decimal expansions exactly, and high scales increase memory and computation time. BigFraction, on the other hand, can represent rational numbers exactly as fractions, preserving mathematical precision—but only if constructed carefully, for example from integer numerators and denominators or from a BigDecimal using its unscaled value and scale.
In all cases, it is crucial to be aware of these limitations and potential pitfalls. Understanding how each type stores and calculates numbers helps you make informed decisions and avoid subtle errors in your calculations.
When building apps that use a SQL database, it’s easy to run into performance problems without noticing. Many of these issues come from the way queries are written and used in the code. Below are seven common SQL mistakes developers make, why they happen, and how you can avoid them.
Not Using Prepared Statements
One of the most common mistakes is building SQL queries by concatenating strings. This approach not only introduces the risk of SQL injection but also prevents the database from reusing execution plans. Prepared statements or parameterized queries let the database understand the structure of the query ahead of time, which improves performance and security. They also help avoid subtle bugs caused by incorrect string formatting or escaping.
// Vulnerable and inefficient
String userId = "42";
Statement stmt = connection.createStatement();
ResultSet rs = stmt.executeQuery("SELECT * FROM users WHERE id = " + userId);
// Safe and performant
String sql = "SELECT * FROM users WHERE id = ?";
PreparedStatement ps = connection.prepareStatement(sql);
ps.setInt(1, 42);
ResultSet rs = ps.executeQuery();
The N+1 Query Problem
The N+1 problem happens when an application fetches a list of items and then runs a separate query for each item to retrieve related data. For example, fetching a list of users and then querying each user’s posts in a loop. This results in one query to fetch the users and N additional queries for their posts. The fix is to restructure the query using joins or batch-fetching strategies, so all the data can be retrieved in fewer queries.
When queries filter or join on columns that do not have indexes, the database may need to scan entire tables to find matching rows. This can be very slow, especially as data grows. Adding the right indexes can drastically improve performance. It’s important to monitor slow queries and check whether indexes exist on the columns used in WHERE clauses, JOINs, and ORDER BY clauses.
Here’s how to create an index on an “orders” table for its “customer_id” column:
CREATE INDEX idx_orders_customer_id ON orders(customer_id);
Once the index is added, the query can efficiently find matching rows without scanning the full table.
Retrieving Too Much Data
Using SELECT * to fetch all columns from a table is a common habit, but it often retrieves more data than the application needs. This can increase network load and memory usage. Similarly, not using pagination when retrieving large result sets can lead to long query times and a poor user experience. Always select only the necessary columns and use LIMIT or OFFSET clauses to manage result size.
Some applications make many small queries in a single request cycle, creating high overhead from repeated database access. Each round-trip to the database introduces latency. Here’s an inefficient example:
for (int id : productIds) {
    PreparedStatement ps = connection.prepareStatement(
        "UPDATE products SET price = price * 1.1 WHERE id = ?"
    );
    ps.setInt(1, id);
    ps.executeUpdate();
}
Instead of issuing separate queries, it’s often better to combine them or use batch operations where possible. This reduces the number of database interactions and improves overall throughput:
PreparedStatement ps = connection.prepareStatement(
    "UPDATE products SET price = price * 1.1 WHERE id = ?"
);

for (int id : productIds) {
    ps.setInt(1, id);
    ps.addBatch();
}
ps.executeBatch();
Improper Connection Pooling
Establishing a new connection to the database for every query or request is slow and resource-intensive. Connection pooling allows applications to reuse database connections, avoiding the cost of repeatedly opening and closing them. Applications that do not use pooling efficiently may suffer from connection exhaustion or high latency under load. To avoid this use a connection pooler and configure it with appropriate limits for the workload.
Unbounded Wildcard Searches
Using wildcard searches with patterns like '%term%' in a WHERE clause causes the database to scan the entire table, because indexes cannot be used effectively. These searches are expensive and scale poorly. To handle partial matches more efficiently, consider using full-text search features provided by the database, which are designed for fast text searching. Here’s an example in PosgreSQL:
SELECT * FROM articles
WHERE to_tsvector('english', title) @@ to_tsquery('database');
By being mindful of these common pitfalls, you can write SQL that scales well and performs reliably under load. Good database performance isn’t just about writing correct queries – it’s about writing efficient ones.
Have you faced any of these problems before? Every project is different, and we all learn a lot from the challenges we run into. Feel free to share your experiences or tips in the comments. Your story could help someone else improve their app’s performance too.
A few years ago, domain specific languages (DSLs) were a really hot topic and “the future”. Now, after the dust has settled there are a bunch of successful and useful examples like LINQ and Gradle but no holy grail buzz anymore.
In some of our projects we did implement some small embedded DSLs (eDSL) if we expected great benefit. Most of the time they are just working silently in the background of our solutions. But sometimes they really shine:
A recent story involving a DSL
A few days ago, I got a request from one of our customers regarding a complex “traffic light”-like system for scientific proposals in a proposal submission system. Each proposal goes through a bunch of phases where different parties have participate. While that sounds relatively simple our system has different proposal types, different roles, different states over time and so on.
All of the above leads to “Starbuck’s menu”-style complexity. And now, after several years in production the customer comes up with some special cases that are counterintuitive.
Expecting the worst I dived into the source code and was delighted to see a quite expressive DSL. Our project and thus also the DSL for the “status overview” feature leveraged the flexible syntax of Groovy (which is also used by Gradle). After a few minutes I could not only understand all the rules for the different status lights but also pin-point the cases in question.
I then moved forward and used the rule definition in our DSL to talk to our customer directly! And after a few more minutes he – as the domain expert – also understood our rule definition and the cause for the irritating display of a certain combination of proposal type, role and phase.
The fix was more or less straightforward and I simply handed that one source file to our customer for future reference.
Here is an excerpt of our status phase rules written in our own DSL:
PhaseRules {
    submission {
        green {
            proposal.isValidated()
        }
        red {
           !proposal.isValidated()
        }
        white {
            false
        }
        user {
            yellow {
                proposal.isCallPhaseIndependent())
            }
            grey {
                false
            }
        }
        scientist {
            yellow {
                false
            }
            grey {
                proposalNeedsValidationByProposer(proposal)
            }
        }
        userOffice {
            yellow {
                false
            }
            grey {
                proposalNeedsValidationByProposer(proposal)
            }
        }
    }

    check {
        green {
            proposal.isValidated() && proposal.hasFeasibilityComment()
        }
        red {
        }
    }
    // more phases, roles, states and rules omitted...
}
In that moment I was very proud of my project team, their decision to implement a DSL for this feature and an appropriate implementation.
It saved me a lot of headaches and quite some time. Furthermore it reinforced our customers trust in the application and improved the transparency and traceability of our solution.
This high level abstraction let both me and the customer ignore all the implementation details and focus on the actual functionality and behaviour correcting/improving the status display for our users.