Speeding up your HQL

Using an object-relational-mapper (ORM) to persist your entities, manage their state and query subsets for lists or reports is a wide-spread practice and may speed up your development.

If not used correctly, it may introduce unexpected performance problems because of unefficient default queries and the overhead this mapping introduces as most of the time table rows are converted to domain objects. Often this results in many queries and the n+1 query problem.

Nevertheless, the benefits of using an ORM may outweigh the problems and most problems can be mitigated by features and a correct usage of the tool.

Today I want to present a performance problem we had using GORM/Hibernate and how we easily fixed it without major code restructuring or workarounds.

The Problem

We used a HQL-query to load quite a lot of entities which took about 3 seconds. This was acceptable for our customer. If the user however tried to narrow down the results using a filter loading a smaller amount of the same entities took over 1 minute. Obviously, this was totally unacceptable and counter-intuitive.

The Analysis

Further analysis revealed, that a particular part of the WHERE-clause was responsible for the observed slowdown:

FROM Report r
WHERE r.project.proposal.id = p.id

So we did filter the root entity Report on an entity called Proposal but needed to load an associated Project entity for all reports to consider. So even if we are just using entity-ids to filter the innocently looking path r.project.proposal.id leads to loading and mapping of hundreds of Project entities.

The Solution

In our example we can fortunately do a lot better without big changes to our domain model, the application code or the query.

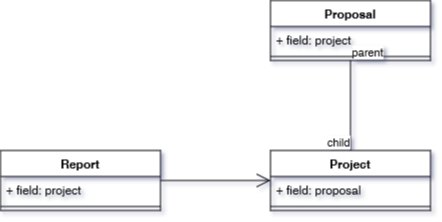
The relevant part of the schema looks like below:

In the above schema we can see, that both, a Report and a Proposal are associated with a certain project. Remember, that in Hibernate your entities contain only the id of their one-to-one mapped sub-entities by default. This means that if we change the filter clause to

WHERE r.project.id = p.project.id

we skip loading and mapping of all the Project entities and only load the needed reports and proposals. Since they both contain the project id we can use that in our filter. This resulted in more than a 10x speedup with such a simple and non-invasive change.

General Takeaway

ORMs can be a great tool but it is very easy to shoot yourself into the foot. With enough care you can achieve both simple code and good performance but you may run into non-obvious problems every now and then.

Game Optimization Resolved

In my last blog post, I explained a performance problem in my game abstractanks but not how I solved it.

So I had not done any optimization work in a while, so the first thing I did turned out to be an error. And not only in hindsight – I actually knew how to tackle a problem like that – I just temporarily forgot at that point.

Going down the rabbit hole

Where we left off, my profiler showed FriendlyUnitOccupies as the culprit. That function basically does circle/circle collision detection using a quad-tree as the spatial acceleration structure. Looking at the samples from my profiler, I could see that that it was descending into the tree quite deeply. Like all tree structures, a quad-tree does pointer-chasing which is very bad for modern CPUs. So I figured I should look at how to optimize that. The data structure was implemented in a hurry, so there seemed plenty to do:

  • Instead of recursing into each node, use tail-call optimization and early culling to speed up traversal.
  • Pre-cache the query with the max-search radius and the other requirements to the units, e.g. not dead, same team, etc.. and then use that to build a new tree for the actual queries.

Because the data structure was pretty non-generic, I started to basically rewrite it to use it in this scenario. While I was about half way through with that, it dawned on me that I was barking at the wrong tree.

Taking a step back

The excellent book Video Game Optimization has some great advice on which level to attack an optimization problem.

  1. System-level. Can you change the system to do something differently and still solve your problem?
  2. Algorithm-level. Are you using the most efficient right algorithm for the data you have?
  3. Micro-level. Are you not wasting any processing power on the lower levels?

I was already on the algorithm level. So I went back to the systemic level: What if the AI did not try to change the target position that often, maybe just every few seconds? That effectively meant lowering the AIs APM. It’s not a bad solution, especially since that makes the AI behave more human. But on the other hand, real-time games, as the name implies, have a soft real-time requirement. So you generally like to avoid huge workloads that go over your frame budget. With how slow the algorithm was, that could easily be the case. The solution is then to do the work concurrently, either by splitting it up or doing it in the background. Both solutions seemed difficult, since the AI code does currently not allow for easy concurrency. So that idea was out.

What if the parking-positions where cached? Subsequent calls to get parking positions could probably reuse a lot of the positions that were computed in previous frames, given that the target point only moves by a little bit each frame. I figured that might work, but it requires more housekeeping and data-dependencies – the result of the previous query needs to be used for the next. That seemed complex and therefore brittle.

A Solution?

Temporal coherency was a pretty good idea though, but not the scale was to big this time. What if I exploited it within a single frame? Now the original code did obscure this, but maybe it gets a little more clear if I write it like this:

optional<v2> GameWorld::FindFreePosition(v2 Center, std::vector<v2> const& Occupied)
{
  auto CheckPosition = [&](v2 Candiate)
  {
    if (!IsPassable(Candidate))
      return false;

    if (OverlapsWith(Occupied))
      return false;

    return !FriendlyUnitOccupies(Candidate);  
  };
  auto Samples = SampledPositions(Center, SomeRandomness());
  auto Found = find_if(SampledPositions.begin(), SampledPositions.end(), CheckPosition(Position));
  
  return (Found != SampledPositions.end()) ? *Found : none;
}

Now as I explained in the previous post, this was called in a loop for each unit to be parked.

std::vector<v2> GameWorld::FindParkingPositions(v2 Center, std::size_t N)
{
  std::vector<v2> Results;
  for (std::size_t i = 0; i < N; ++i)
  {
    auto MaybePosition = FindFreePosition(Center, Results);
    if (!MaybePosition) // No more free space?
      break;
    Results.push_back(*MaybePosition);
  }
  return Results;
}

Easy to see: counting the number of CheckPosition calls, this algorithm is O(n) in number of sampled positions. The number of sampled positions depends linearly on the number of units to be parked, because more units obviously need more parking positions, essentially making this O(n²) for the unit count! But the positions get resampled for each unit – with the only change being the little bit of randomness that is injected everytime. In other words, each call would just test false for sampled positions roughly corresponding to the units that are already placed.

So what I did was a very small change: only inject the randomness once and merge the loops:

auto Samples = SampledPositions(Center, SomeRandomness());
std::vector<v2> Results;

for (auto const& Sample : Samples)
{
  if (CheckPosition(Sample))
    Results.push_back(Sample);

  if (Result.size() >= N)
    break;
}
return Results;

And this did the trick! The algorithm’s run-time when below the 1ms range, and the smaller variation in randomness is not really visible.

Conslusions

I was thrown off-track be the false conclusion that CheckPositions was too slow when it was in fact just called too often. Context is key! Always approach these things outside-in.
Using less-than-optimal abstractions obscured the opportunity to hoist out the sample generation from me. Iteration is always a separate concern, even when it is not on containers!

OPC-UA Performance and Bulk Reads

In a previous post on OPC on this blog I introduced some basics of OPC. Now we’ll take look at some performance characteristics of OPC-UA. Performance depends both on the used OPC server and the client, of course. But there are general tips to improve performance.

  • to get maximum performance use OPC without security

OPC message signing and encryption adds overhead. Turn off security for maximum performance if your use case allows to use OPC without security.

  • bulk reads increase performance

Bulk reads

A bulk read call reads multiple variables at once, which reduces communication overhead between client and server.

Here’s a code example using Eclipse Milo, an open-source OPC-UA stack implementation for the Java VM.

final String endpointUrl = "opc.tcp://localhost:53530/OPCUA/SimulationServer";
final EndpointDescription[] endpoints = UaTcpStackClient.getEndpoints(endpointUrl).get();
final OpcUaClientConfigBuilder config = new OpcUaClientConfigBuilder();
config.setEndpoint(endpoints[0]);

final OpcUaClient client = new OpcUaClient(config.build());
client.connect().get();

final List<NodeId> nodeIds = IntStream.rangeClosed(1, 50).mapToObj(i -> new NodeId(5, "Counter" + i)).collect(Collectors.toList());
final List<ReadValueId> readValueIds = nodeIds.stream().map(nodeId -> new ReadValueId(nodeId, AttributeId.Value.uid(), null, null)).collect(Collectors.toList());

// Bulk read call
final ReadResponse response = client.read(0, TimestampsToReturn.Both, readValueIds).get();
final DataValue[] results = response.getResults();
if (null != results) {
	final List<Integer> values = Arrays.stream(results).map(result -> (Integer) result.getValue().getValue()).collect(Collectors.toList());
	System.out.println(values.stream().map(String::valueOf).collect(Collectors.joining(",")));
}

client.disconnect().get();

The code performs a bulk read call on 50 integer variables (“Counter1” to “Counter50”). For performance tests you can put the bulk read call in a loop and measure the times. You should, however, connect to the server over the target network, not on localhost.

With a free (however not open-source) OPC UA simulation server by Prosys and Eclipse Milo for the client I measured times around 3.3 ms per bulk read of these 50 integer variables. I got similar results with the UA.NET stack by the OPC Foundation. Of course, you should do your own measurements with your target setup.

Keep also in mind that the preferred way to use OPC UA is not to constantly poll the values of all the variables. OPC UA allows you to monitor variables for changes and to get notified in case of a change, which is a more event-driven approach.

The tables will eventually turn for every optimization

Nearly all performance optimizations turn sour sooner or later. Here’s a story that illustrates the concept and gives a simple ruleset to avoid the effect.

An inconvenient truth

One of the things every software developer has to learn the hard way is that performance optimizations are a bad thing most of the time. The lesson is counter-intuitive because it is in conflict with several fundamental motivations of our artist/engineer attitude:

  • We want our code to be as fast as possible or even faster. (We really like the prospect of making the impossible happen!)
  • We don’t want to waste resources if it can be avoided. (Digital resources have always been scarce. Development in abundance wasn’t taught!)
  • We want to be clever and one-up everybody with the latest trick/hack. (This ego boost driven development attitude is a major problem on its own!)

But we can’t deny that clever guys exist since forever and that their wisdom should be considered. Here’s one clever guy fourty years ago:

premature optimization is the root of all evil.

said Donald Knuth in 1974. A typical computer had RAM in the lower kilobyte range these days and clocked with around a megahertz. The Intel 8080 was introduced in this year. No sign of abundance all around.

Coming from this insight, i teach the “three rules of performance optimization” to my students:

  1. Don’t
  2. Not Yet
  3. Measure

A little disclaimer: Performance optimizations are measured in milliseconds. You are still responsible for complexity optimizations and should engage them. Complexity is measured in O(n).

I blogged about the rules some time ago, so I won’t repeat the whole meaning behind them. Today, I want to tell a story related to rule three (“Measure”) and why it’s generally a good idea to stay clear of optimizations if not absolutely necessary.

An accidental observation

by ortodoxfoto / fotolia

In one of our long-running projects, we store data in a 24/7 manner since more than ten years. The project started on Pentium IV boxes with 120 GB harddisks. Soon enough, the available disk space vanished rapidely. Our customer wanted to optimize the storage efficiency. We told him that we can always trade storage space versus computation time or the other way around (the infamous space/time tradeoff), but if we compress the data in the system’s archive to save space, it will result in slower archive access. Our customer understood the tradeoff and decided he wanted storage efficiency over access speed for the archive.

So we added a compression step when certain data types were stored in the archive. Because the data was text based (XML and other formats), the compression rate was at 90% and even higher, meaning that we could fit ten times more data on the disk than before. We certainly met the customer’s goal of store efficiency. But what about the access speed? We needed to add the decompression step for certain data types at the place where our system loads from the archive. After that, we hoped that the speed didn’t suffer too badly. We measured the access times before and after the change and couldn’t believe our eyes: The access time was nearly ten times faster than before. There was no tradeoff, we actually shrank memory consumption and computation time at once and in the same ballpark figure. We felt like heros.

Discovering false premises

Why did this happen? Our explanation is that at some specific point in time, the CPUs became too fast for a tradeoff. In the good old days, there really was a tradeoff: if you needed to compress parts of your harddisk to save space, loading these parts became slower. Because the CPU had to perform extra work on top of the loading, you had to wait longer. Loading more data directly from disk was faster than loading less data from disk and decompressing it. When the CPU became fast enough to actually decompress during the I/O delay of the harddisk, that’s when the raw amount of data that needed to be transferred from disk determined the loading speed. And since uncompressed data is larger, it now took longer to load than compressed data.

At some specific point in time, the old wisdom that compressed data is slower became a lie. Nobody told us. We weren’t heros, we just lived on false premises.

Our customer was pleased and continued to be pleased for years. Every few years, the CPUs of the target machines would become even faster, but the harddisk performance would hardly improve. The new wisdom was truer than ever: Less data is faster, regardless of what the CPU has to do with it. This was a performance optimization that could be used everywhere. You want to increase I/O speed? Compress the data.

The tables begin to turn

Fast forward to modern days. A new technology promised to improve harddisk performance by orders of magnitude: The solid state disk (SSD) delivers impressive amounts of data per second, but more important, gets rid of the initial seek time that magnetic spindle disks had (those few milliseconds to locate the data on the disk that felt like ages for modern CPUs). We started our migration to SSD in 2010 and were SSD-exclusive at the end of 2013. Our customer was a bit more hesistant, but the latest generation of target machines run on SSDs, too. So how did this affect our performance optimization?

As you can probably deduce by now, the decompression work of the CPU re-emerged in the archive access time. It’s by no means as bad as in ancient times, but the days of “no tradeoff” are gone, again. The performance optimization isn’t an optimization anymore. We still have it in the system, because it was never meant to improve performance, but storage efficiency, and it still does that perfectly. And needs to, because SSD are still expensive and don’t offer storage space in abundance. But the old wisdom is back (partially): compressed data is slower, if not by much.

What do we learn from this?

Over the course of a few years, a specific feature (transparent storage compression) in our system was a performance burden, then a performance booster and a burden again. We didn’t change the code, we just changed the hardware circumstances. The best lesson to be learnt is that no performance optimization lasts forever. Premises will change. Effects will be negated. Bottlenecks will be shifted. It’s best to know when that happens. And then it’s best to be able to revoke the optimization. Or, if all this sounds way too much trouble for such a tiny performance gain, remember the first rule of performance optimization (Don’t) and just leave it alone. You can always tell yourself that you’ve just optimized your code for the machine it will run on in ten years.

Recap of the Schneide Dev Brunch 2015-08-09

If you couldn’t attend the Schneide Dev Brunch at 9th of August 2015, here is a summary of the main topics.

brunch64-borderedTwo weeks ago, we held another Schneide Dev Brunch, a regular brunch on the second sunday of every other (even) month, only that all attendees want to talk about software development and various other topics. So if you bring a software-related topic along with your food, everyone has something to share. The brunch was well attented this time with enough stuff to talk about. As usual, a lot of topics and chatter were exchanged. This recapitulation tries to highlight the main topics of the brunch, but cannot reiterate everything that was spoken. If you were there, you probably find this list inconclusive:

News on Docker

Docker is the hottest topic among developers and operators in 2015. No wonder we started chatting about it the minute we sat down. There are currently two interesting platform projects that provide runtime services for docker: Tutum (commercial) and Rancher (open source). We all noted the names and will check them out. The next interesting fact was that Docker is programmed in the Go language. The team probably one day decided to give it a go.

Air Conditioning

We all experienced the hot spell this summer and observed that work in the traditional sense is impossible beyond 30° Celsius. Why there are still so few air conditioned offices in our region is beyond our grasp. Especially since it’s possible to power the air condition system with green electricity and let sun-power deal with the problem that, well, the sun brought us. In 2015 alone, there are at minimum two work weeks lost to the heat. The productivity gain from cooling should outweigh the costs.

License Management

We talked about how different organisations deal with the challenge of software license management. Nearly every big company has a tool that does essentially the same license management but has its own cool name. Other than that, bad license management is such a great productivity killer that even air conditioning wouldn’t offset it.

Windows 10

Even if we are largely operation system agnostic, the release of Windows 10 is hot news. A few of our participants already tried it and concluded that “it’s another Windows”. A rather confusing aspect is the split system settings. And you have to abdicate the Cortana assistant if you want to avoid the data gathering.

Patch Management

A rather depressing topic was the discussion about security patches. I just repeat two highlights: A substantial number of servers on the internet are still vulnerable to the heartbleed attack. And if a car manufacturer starts a big recall campaign with cost-free replacements, less than 10 percent of the entitled cars are actually fixed on average. These explicitely includes safety-critical issues. That shouldn’t excuse us as an industry for our own shortcomings and it’s not reassuring to see that other industries face the same problems.

Self-Driving Cars

We disgressed on the future hype topic of self-driving cars. I can’t reiterate the complete discussion, but we agreed that those cars will hit the streets within the next ten years. The first use case will be freight transports, because the cargo doesn’t mind if the driver is absent and efficiency matters a lot in logistics. Plus, machines don’t need breaks. Ok, those were enough puns on the topic. Sorry.

Tests on Interfaces

An interesting question was how to build tests that can ensure a class or interface contract. Much like regression tests for recently broken functionality, compatibility tests should deal with backward compatibility issues in the interface. Turns out, the Eclipse foundation gave the topic some thoughts and came up with an exhaustive list of aspects to check. There are even some tools that might come in handy if you want to compare two versions of an API.

API Design

When the topic of API Design came up, some veterans of the Schneide Events immediately mentioned the API Design Fest we held in November 2013 to get our noses bloody on API design. Well, bleed we did. The most important take-away from the Fest was that if you plan to publish an API that can endure some years in production while being enhanced and improved, you just shouldn’t do it. Really, don’t do it, it’s probably a bad idea and you lack the required skill without even knowing it. If you want to know, participate or even host an API Design Fest.

And if you happen to design a web-based API, you might abandon backward compatibility by offering several distinct “versions” of APIs of a service. The version is included in the API URL, and acts more like a name than a version. This will ease your burden a bit. A nice reference resource might also be the PayPal API style guide.

Let’s just agree that API design is really hard and should not be done until it’s clear you don’t suffer from Dunning-Kruger effect symptoms too much.

Performance Tests

We talked about the most effective setup of performance tests. There were a lot of ideas and we cornerstoned the topic around this:

  • There was a nearly heroic effort from the Eclipse development team to measure their IDE performance, especially to compare different versions of the IDE. The Eclipse Test & Performance Tools Platform (TPTP) was (as in: discontinued) a toolkit of interesting approaches to the topic. The IDE itself was measured by performance fingerprints like this example from 2011. As far as we know, all those things ceased to exist.
  • At the last Java Forum Stuttgart, there was a talk about performance testing from an experienced tester that loved to give specific advice. The slides can be viewed online in german language (well, not really, but the talk was).
  • The book Release It! has a lot of insights to this topic. It’s one of the bigger books on the pragmatic bookshelf.
  • The engineers at NetFlix actually did a lot of thinking about the topic. They came up with Hystrix, a resilience library, aimed to make it easier to prevent complete system blackouts. They also came up with Chaos Monkey, a service that makes it easier to have a complete system blackout. If we can say anything about NetFlix, it is that they definitely approach their problems from the right angle.

Company Culture

Leaking over from the previous topic about effective performance-related measures, we talked about different company cultures, especially in regard to a centralized human resources departments and works council (german: Betriebsrat). We agreed that it is very difficult to maintain a certain culture and continued growth. We also agreed that culture trickles down from top management.

OpenGL

The last topic on this Dev Brunch was about the rendering of text or single characters in OpenGL. By using signed distance fields, you can render text more crisp and still only use cheap computation instructions. There is a paper from Valve on the topic that highlights the benefits and gives a list of additional reading. It’s always cool to learn about something simple that actually improves things.

Epilogue

As usual, the Dev Brunch contained a lot more chatter and talk than listed here. The number of attendees makes for an unique experience every time. We are looking forward to the next Dev Brunch at the Softwareschneiderei. And as always, we are open for guests and future regulars. Just drop us a notice and we’ll invite you over next time.

Build your own performance and log monitoring solution

Tips for a better performance only help when you know where you can improve performance. So to find the places where speed is needed you can monitor the performance of your app in production. Here we build a simple performance and log monitoring solution.

Tips for a better performance like using views or reducing the complexity of your algorithms only help when you know where you can improve performance. So to find the places where speed is needed you can build extensive load and performance tests or even better you can monitor the performance of your app in production. Many solutions exists which give you varying levels of detail (the costs of them also varies). But often a simple solution is enough. We start with a typical (CRUD) web app and build a monitor and a tool to analyse response times. The goal is to see what are the ten worst performing queries of the last week. We want an answer to this question continuously and maybe ask additional questions like what were the details of the responses like user/role, URL, max/min, views or persistence. A web app built on Rails gives us a lot of measurements we need out of the box but how do we extract this information from the logs?
Typical log entries from an app running on JRuby on Rails 4 using Tomcat looks like this:

Sep 11, 2014 7:05:29 AM org.apache.catalina.core.ApplicationContext log
Information: I, [2014-09-11T07:05:29.455000 #1234]  INFO -- : [19e15e24-a023-4a33-9a60-8474b61c95fb] Started GET "/my-app/" for 127.0.0.1 at 2014-09-11 07:05:29 +0200

...

Sep 11, 2014 7:05:29 AM org.apache.catalina.core.ApplicationContext log
Information: I, [2014-09-11T07:05:29.501000 #1234]  INFO -- : [19e15e24-a023-4a33-9a60-8474b61c95fb] Completed 200 OK in 46ms (Views: 15.0ms | ActiveRecord: 0.0ms)

Important to identify log entries for the same request is the request identifier, in our case 19e15e24-a023-4a33-9a60-8474b61c95fb. To see this in the log you need to add the following line to your config/environments/production.rb:

config.log_tags = [ :uuid ]

Now we could parse the logs manually and store them in a database. That’s what we do but we use some tools from the open source community to help us. Logstash is a tool to collect, parse and store logs and events. It reads the logs via so called inputs, parses, aggregates and filters with the help of filters and stores by outputs. Since logstash is by Elasticsearch – the company – we use elasticsearch – the product – as our database. Elasticsearch is a powerful search and analytcs platform. Think: a REST frontend to Lucene – only much better.

So first we need a way to read in our log files. Logstash stores its config in logstash.conf and reads file with the file input:

input {
  file {
    path => "/path/to/logs/localhost.2014-09-*.log"
    # uncomment these lines if you want to reread the logs
    # start_position => "beginning"
    # sincedb_path => "/dev/null"
    codec => multiline {
      pattern => "^%{MONTH}"
      what => "previous"
      negate => true
    }
  }
}

There are some interesting things to note here. We use wildcards to match the desired input files. If we want to reread one or more of the log files we need to tell logstash to start from the beginning of the file and forget that the file was already read. Logstash remembers the position and the last time the file was read in a sincedb_path to ignore that we just specify /dev/null as a path. Inputs (and outputs) can have codecs. Here we join the lines in the log which do not start with a month. This helps us to record stack traces or multiline log entries as one event.
Add an output to stdout to the config file:

output {
  stdout {
    codec => rubydebug{}
  }
}

Start logstash with

logstash -f logstash.conf --verbose

and you should see your log entries as json output with the line in the field message.
To analyse the events we need to categorise them or tag them for this we use the grep filter:

filter {
  grep {
    add_tag => ["request_started"]
    match => ["message", "Information: .* Started .*"]
    drop => false
  }
}

Grep normally drops all non matching events, so we need to pass drop => false. This filter adds a tag to all events with the message field matching our regexp. We can add filters for matching the completed and error events accordingly:

  grep {
    add_tag => ["request_completed"]
    match => ["message", "Information: .* Completed .*"]
    drop => false
  }
  grep {
    add_tag => ["error"]
    match => ["message", "\:\:Error"]
    drop => false
  }

Now we know which event starts and which ends a request but how do we extract the duration and the request id? For this logstash has a filter named grok. One of the more powerful filters it can extract information and store them into fields via regexps. Furthermore it comes with predefined expressions for common things like timestamps, ip addresses, numbers, log levels and much more. Take a look at the source to see a full list. Since these patterns can be complex there’s a handy little tool with which you can test your patterns called grok debug.
If we want to extract the URL from the started event we could use:

grok {
    match => ["message", ".* \[%{TIMESTAMP_ISO8601:timestamp} \#%{NUMBER:}\].*%{LOGLEVEL:level} .* \[%{UUID:request_id}\] Started %{WORD:method} \"%{URIPATHPARAM:uri}\" for %{IP:} at %{GREEDYDATA:}"]
 }

For the duration of the completed event it looks like:

grok {
    match => ["message", ".* \[%{TIMESTAMP_ISO8601:timestamp} \#%{NUMBER:}\].*%{LOGLEVEL:level} .* \[%{UUID:request_id}\] Completed %{NUMBER:http_code} %{GREEDYDATA:http_code_verbose} in %{NUMBER:duration:float}ms (\((Views: %{NUMBER:duration_views:float}ms \| )?ActiveRecord: %{NUMBER:duration_active_record:float}ms\))?"]
 }

Grok patterns are inside of %{} like %{NUMBER:duration:float} where NUMBER is the name of the pattern, duration is the optional field and float the data type. As of this writing grok only supports floats or integers as data types, everything else is stored as string.
Storing the events in elasticsearch is straightforward replace or add to your stdout output an elasticsearch output:

output {
  elasticsearch {
    protocol => "http"
    host => localhost
    index => myindex
  }
}

Looking at the events you see that start events contain the URL and the completed events the duration. For analysing it would be easier to have them in one place. But the default filters and codecs do not support this. Fortunately it is easy to develop your own custom filter. Since logstash is written in JRuby, all you need to do is write a Ruby class that implements register and filter:

require "logstash/filters/base"
require "logstash/namespace"

class LogStash::Filters::Transport < LogStash::Filters::Base

  # Setting the config_name here is required. This is how you
  # configure this filter from your logstash config.
  #
  # filter {
  #   transport { ... }
  # }
  config_name "transport"
  milestone 1

  def initialize(config = {})
    super
    @threadsafe = false
    @running = Hash.new
  end 

  def register
    # nothing to do
  end

  def filter(event)
    if event["tags"].include? 'request_started'
      @running[event["request_id"]] = event["uri"]
    end
    if event["tags"].include? 'request_completed'
      event["uri"] = @running.delete event["request_id"]
    end
  end
end

We name the class and config name ‘transport’ and declare it as milestone 1 (since it is a new plugin). In the filter method we remember the URL for each request and store it in the completed event. Insert this into a file named transport.rb in logstash/filters and call logstash with the path to the parent of the logstash dir.

logstash --pluginpath . -f logstash.conf --verbose

All our events are now in elasticsearch point your browser to http://localhost:9200/_search?pretty or where your elasticsearch is running and it should return the first few events. You can test some queries like _search?q=tags:request_completed (to see the completed events) or _search?q=duration:[1000 TO *] to get the events with a duration of 1000 ms and more. Now to the questions we want to be answered: what are the worst top ten response times by URL? For this we need to group the events by URL (field uri) and calculate the average duration:

curl -XPOST 'http://localhost:9200/_search?pretty' -d '
{
  "size":0,
  "query": {
    "query_string": {
      "query": "tags:request_completed AND timestamp:[7d/d TO *]"
     }
  },
  "aggs": {
    "group_by_uri": {
      "terms": {
        "field": "uri.raw",
        "min_doc_count": 1,
        "size":10,
        "order": {
          "avg_per_uri": "desc"
        }
      },
      "aggs": {
        "avg_per_uri": {
          "avg": {"field": "duration"}
        }
      }
    }
  }
}'

See that we use uri.raw to get the whole URL. Elasticsearch separates the URL by the /, so grouping by uri would mean grouping by every part of the path. now-7d/d means 7 days ago. All groups of events are included but if we want to limit our aggregation to groups with a minimum size we need to alter min_doc_count. Now we have an answer but it is pretty unreadable. Why not have a website with a list?
Since we don’t need a whole web app we could just use Angular and the elasticsearch JavaScript API to write a small page. This page displays the top ten list and when you click on one it lists all events for the corresponding URL.

<!DOCTYPE html>
<html>
  <head>
    <script type="text/javascript" src="https://ajax.googleapis.com/ajax/libs/angularjs/1.2.11/angular.min.js"></script>
    <script type="text/javascript" src="elasticsearch-js/elasticsearch.angular.js"></script>
    <script type="text/javascript" src="monitoring.js"></script>

    <link rel="stylesheet" href="http://netdna.bootstrapcdn.com/bootstrap/3.1.0/css/bootstrap.min.css">
    <link rel="stylesheet" href="http://netdna.bootstrapcdn.com/bootstrap/3.1.0/css/bootstrap-theme.min.css">
  </head>
  <body>
    <div ng-app="Monitoring" class="container" ng-controller="Monitoring">
      <div class="col-md-6">
        <h2>Last week's top ten slowest requests</h2>
        <table class="table">
          <thead>
            <tr>
              <th>URL</th>
              <th>Average Response Time (ms)</th>
            </tr>
          </thead>
          <tbody>
            <tr ng-repeat="request in top_slow track by $index">
              <td><a href ng-click="details_of(request.key)">{{request.key}}</a></td>
              <td>{{request.avg_per_uri.value}}</td>
            </tr>
          </tbody>
        </table>
      </div>
      <div class="col-md-6">
        <h3>Details</h3>
        <table class="table">
          <thead>
            <tr>
              <th>Logs</th>
            </tr>
          </thead>
          <tbody>
            <tr ng-repeat="line in details track by $index">
              <td>{{line._source.message}}</td>
            </tr>
          </tbody>
        </table>
      </div>
    </div>
  </body>
</html>

And the corresponding Angular app:

var module = angular.module("Monitoring", ['elasticsearch']);

module.service('client', function (esFactory) {
  return esFactory({
    host: 'localhost:9200'
  });
});

module.controller('Monitoring', ['$scope', 'client', function ($scope, client) {
var indexName = 'myindex';
client.search({
index: indexName,
body: {
  "size":0,
  "query": {
    "query_string": {
      "query": "tags:request_completed AND timestamp:[now-1d/d TO *]"
     }
  },
  "aggs": {
    "group_by_uri": {
      "terms": {
        "field": "uri.raw",
        "min_doc_count": 1,
        "size":10,
        "order": {
          "avg_per_uri": "desc"
        }
      },
      "aggs": {
        "avg_per_uri": {
          "avg": {"field": "duration"}
        }
      }
    }
  }
}
}, function(error, response) {
  $scope.top_slow = response.aggregations.group_by_uri.buckets;
});

$scope.details_of = function(url) {
client.search({
index: indexName,
body: {
  "size": 100,
  "sort": [
    { "timestamp": "asc" }
  ],
  "query": {
    "query_string": {
      "query": 'timestamp:[now-1d/d TO *] AND uri:"' + url + '"'
     }
  },
}
}, function(error, response) {
  $scope.details = response.hits.hits;
});
};
}]);

This is just a start. Now we could filter out the errors, combine logs from different sources or write visualisations with d3. At least we see where performance problems lie and take further steps at the right places.

How to speed up your ORM queries of n x m associations

What solution (no cache) causes a 45x speedup? Learn the different approaches and how they compare

What causes a speedup like this? (all numbers are in ms)

Disclaimer: the absolute benchmark numbers are for illustration purposes, the relationship and the speedup between the different approaches are important (just for the curious: I measured 500 entries per table in a PostgreSQL database with both Rails 4.1.0 and Grails 2.3.8 running on Java 7 on a recent MBP running OSX 10.8)

Say you have the model classes Book and (Book)Writer which are connected via a n x m table named Authorship:

A typical query would be to list all books with its authors like:

Fowler, Martin: Refactoring

A straight forward way is to query all authorships:

In Rails:

# 1500 ms
Authorship.all.map {|authorship| "#{authorship.writer.lastname}, #{authorship.writer.firstname}: #{authorship.book.title}"}

In Grails:

// 585 ms
Authorship.list().collect {"${it.writer.lastname}, ${it.writer.firstname}: ${it.book.title}"}

This is unsurprisingly not very fast. The problem with this approach is that it causes the famous n+1 select problem. The first option we have is to use eager fetching. In Rails we can use ‘includes’ or ‘joins’. ‘Includes’ loads the associated objects via additional queries, one for authorship, one for writer and one for book.

# 2300 ms
Authorship.includes(:book, :writer).all

‘Joins’ uses SQL inner joins to load the associated objects.

# 1000 ms
Authorship.joins(:book, :writer).all
# returns only the first element
Authorship.joins(:book, :writer).includes(:book, :writer).all

Additional queries with ‘includes’ in our case slows down the whole request but with joins we can more than halve our time. The combination of both directives causes Rails to return just one record and is therefore ruled out.

In Grails using ‘belongsTo’ on the associations speeds up the request considerably.

class Authorship {
    static belongsTo = [book:Book, writer:BookWriter]

    Book book
    BookWriter writer
}

// 430 ms
Authorship.list()

Also we can implement eager loading with specifying ‘lazy: false’ in our mapping which boosts a mild performance increase.

class Authorship {
    static mapping = {
        book lazy: false
        writer lazy: false
    }
}

// 416 ms
Authorship.list()

Can we do better? The normal approach is to use ‘has_many’ associations and query from one side of the n x m association. Since we use more properties from the writer we start from here.

class Writer < ActiveRecord::Base
  has_many :authors
  has_many :books, through: :authors
end

Testing the different combinations of ‘includes’ and ‘joins’ yields interesting results.

# 1525 ms
Writer.all.joins(:books)

# 2300 ms
Writer.all.includes(:books)

# 196 ms
Writer.all.joins(:books).includes(:books)

With both options our request is now faster than ever (196 ms), a speedup of 7.
What about Grails? Adding ‘hasMany’ and the authorship table as a join table is easy.

class BookWriter {
    static mapping = {
        books joinTable:[name: 'authorships', key: 'writer_id']
    }

    static hasMany = [books:Book]
}
// 313 ms, adding lazy: false results in 295 ms
BookWriter.list().collect {"${it.lastname}, ${it.firstname}: ${it.books*.title}"}

The result is rather disappointing. Only a mild speedup (2x) and even slower than Rails.

Is this the most we can get out of our queries?
Looking at the benchmark results and the detailed numbers Rails shows us hints that the query per se is not the problem anymore but the deserialization. What if we try to limit our created object graph and use a model class backed by a database view? We can create a view containing all the attributes we need even with associations to the books and writers.

create view author_views as (SELECT "authorships"."writer_id" AS writer_id, "authorships"."book_id" AS book_id, "books"."title" AS book_title, "writers"."firstname" AS writer_firstname, "writers"."lastname" AS writer_lastname FROM "authorships" INNER JOIN "books" ON "books"."id" = "authorships"."book_id" INNER JOIN "writers" ON "writers"."id" = "authorships"."writer_id")

Let’s take a look at our request time:

# 15 ms
 AuthorView.select(:writer_lastname, :writer_firstname, :book_title).all.map { |author| "#{author.writer_lastname}, #{author.writer_firstname}: #{author.book_title}" }
// 13 ms
AuthorView.list().collect {"${it.writerLastname}, ${it.writerFirstname}: ${it.bookTitle}"}

13 ms and 15 ms. This surprised me a lot. Seeing this in comparison shows how much this impacts performance of our request.

The lesson here is that sometimes the performance can be improved outside of our code and that mapping database results to objects is a costly operation.

Performance Hogs Sometimes Live in Most Unexpected Places

Surprises when measuring performance are common – but sometimes you just can’t believe it.

When we develop software we always apply the best practice of not optimizing prematurely. This plays together with other best practices like writing the most readable code, or YAGNI.

‘Premature’ means different things in different situations. If you don’t have performance problems it means that there is absolutely no point in optimizing code. And if you do have performance problems it means that Thou Shalt Never Guess which code to optimize because software developers are very bad at this. The keyword here is profiling.

Since we don’t like to be “very bad” at something we always try to improve our skills in this field. The skill of guessing which code has to be optimized, or “profiling in your head” is no different in this regard.

So most of the times in profiling sessions, I have a few unspoken guesses at which parts of the code the profiler will point me to. Unfortunately, I have to say that  I am very often very surprised by the outcome.

Surprises in performance fixing sessions are common but they are of different quality. One rather BIG surprise was to find out that std::string::find of the C++ standard library is significantly slower (by factor > 10) than its C library counterpart strstr (discovered with gcc-4.4.6 on CentOS 6, verified with eglibc-2.13 and gcc-4.7).

Yes, you read right and you may not believe it. That was my reaction, too, so I wrote a little test program containing only two strings and calls to std::string::find and std::strstr, respectively. The results were – and I’ve no problem repeating myself here – a BIG surprise.

The reason for that is that std::strstr uses a highly optimized string matching algorithm version whereas std::string::find works with straight-forward memory comparison.

So when doing profiling sessions, always be prepared for shaking-your-world-view kind of surprises. They can even come from your beloved and highly regarded standard library.

UPDATE: See this stackoverflow question for more information.

The Grails performance switch: flush.mode=commit

Some default configuration options of Grails are not optimal for all projects.

— Disclaimer —
This optimization requires more manual work and is error prone but isn’t this with most (big) performance improvements?
For it to really work you have to structure your code accordingly and flush explicitly.

Recently in our performance measurements of a medium sized Grails project we noticed a strange behavior: every time we executed the same query the time it took increased. It started with 40ms and every time it took 1 ms more. The query was simple like Child.findAllByParent(parent)
The first thought: indexes! We looked at the database (a postgresql db) and we had indexes on the parent column.
Next: maybe the session cache got too large. But session.flush() and session.clear() did not solve that problem.
Another post suggested using a HQL query. Changing to

Child.executeQuery("select new Child(c.name, c.parent) from Child c where parent=:parent", [parent: parent])

had no effect.
Finally after countless more attempts we tried:

session.setFlushMode(FlushMode.COMMIT)

And not even the query executed in constant time it was also 10x faster?!
Hmmm…why?
The default flush mode in Grails is set to AUTO
Which means that before every query made the session is flushed. Every query regardless of the classes effected. The problem is known for hibernate but after 4! years it is still unresolved.
So my question here is: why did Grails chose AUTO as default?

SSD? Don’t think! Just Buy!

SSDs makes everything blazingly fast – even Grails + IDEA development

My personal experience with SSDs began with an Intel X25M that I built into a Lenovo Thinkpad R61. It replaced a Seagate 160 GB 5400rpm which in combination with Windows Vista … well, let’s just say, it wasn’t that fast.

The SSD changed everything. It was not just faster, it was downright awesome! As if I had a completely new computer.

With that in mind I thought about my desktop PC. It’s a little more than 2 year old Windows XP box, Intel Core2Duo 2.7 GHz, 4GB RAM, with a not so slow Samsung HDD. I use it mainly for programming, which is most of the time Grails programming under IntelliJ IDEA.

And let me tell you, the Grails + IDEA combination can get dog slow at times. The start-up time of IDEA alone gives you time to skim over the first three pages of Hacker News and read the latest XKCD.

So the plan was to put an extra SSD into the Windows box and put only programming related stuff on it. This would save me the potential hassle of moving my whole system but would still give me development speed-up.

I had to be a little careful because the standard settings for IDEA’s so-called “system path” and “config path” is in the user’s home directory. (Btw, this settings can be changed in file “idea.properties” which resides in “IDEA_INSTALLATION_DIR\bin”, e.g.: c:\Progam Files\JetBrains\IntelliJ IDEA 9.0.4\bin)

I think you already guessed the result. Three words: fast, faster, SSD. It’s just amazing! IDEA start-up is so fast now, I barely have time for a quick look at the newest headlines on InfoQ.

The next step is of course to put the whole system on SSD but that will probably have to wait until we upgrade the whole company to Win7. Can’t wait… 🙂