Arbitrary 2D curves with Highcharts

Highcharts is a versatile JavaScript charting library for the web. The library supports all kinds of charts: scatter plots, line charts, area chart, bar charts, pie charts and more.

A data series of type line or spline connects the points in the order of the x-axis when rendered. It is possible to invert the axes by setting the property inverted: true in the chart options.

var chart = $('#chart').highcharts({
  chart: {
    inverted: true
  },
  series: [{
    name: 'Example',
    type: 'line',
    data: [
      {x: 10, y: 50},
      {x: 20, y: 56.5},
      {x: 30, y: 46.5},
      // ...
    ]
  }]
});

line-chart-inverted

Connecting points in an arbitrary order

Connecting the points in an arbitrary order, however, is not supported by default. I couldn’t find a Highcharts plugin which supports this either, so I implemented a solution by modifying the getGraphPath function of the series object:

var series = $('#chart').highcharts().series[0];
var oldGetGraphPath = series.getGraphPath;
Object.getPrototypeOf(series).getGraphPath = function(points, nullsAsZeroes, connectCliffs) {
  points = points || this.points;
  points.sort(function(a, b) {
    return a.sortIndex - b.sortIndex;
  });
  return oldGetGraphPath.call(this, points, nullsAsZeroes, connectCliffs);
};

The new function sorts the points by a new property called sortIndex before the line path of the chart gets rendered. This new property must be assigned to each point object of the series data:

series.setData([
  {x: 10, y: 50, sortIndex: 1},
  {x: 20, y: 56.5, sortIndex: 2},
  {x: 30, y: 46.5, sortIndex: 3},
  // ...
], true);

Now we can render charts with points connected in an arbitrary order like this:

A line chart with points connected in arbitrary order

ECMAScript 6 is coming

ECMAScript is the standardized specification of the scripting language that is the basis for JavaScript implementations in web browsers.

ECMAScript 5, which was released in 2009, is in widespread use today. Six years later in 2015 ECMAScript 6 was released, which introduced a lot of new features, especially additions to the syntax.

However, browser support for ES 6 needed some time to catch up.
If you look at the compatibility table for ES 6 support in modern browsers you can see that the current versions of the main browsers now support ES 6. This means that soon you will be able to write ES 6 code without the necessity of a ES6-to-ES5 cross-compiler like Babel.

The two features of ES 6 that will change the way JavaScript code will be written are in my opinion: the new class syntax and the new lambda syntax with lexical scope for ‘this’.

Class syntax

Up to now, if you wanted to define a new type with a constructor and methods on it, you would write something like this:

var MyClass = function(a, b) {
	this.a = a;
	this.b = b;
};
MyClass.prototype.methodA = function() {
	// ...
};
MyClass.prototype.methodB = function() {
	// ...
};
MyClass.prototype.methodC = function() {
	// ...
};

ES 6 introduces syntax support for this pattern with the class keyword, which makes class definitions shorter and more similar to class definitions in other object-oriented programming languages:

class MyClass {
	constructor(a, b) {
		this.a = a;
		this.b = b;
	}
	methodA() {
		// ...
	}
	methodB() {
		// ...
	}
	methodC() {
		// ...
	}
}

Arrow functions and lexical this

The biggest annoyance in JavaScript were the scoping rules of this. You always had to remember to rebind this if you wanted to use it inside an anonymous function:

var self = this;
this.numbers.forEach(function(n) {
    self.doSomething(n);
});

An alternative was to use the bind method on an anonymous function:

this.numbers.forEach(function(n) {
    this.doSomething(n);
}.bind(this));

ES 6 introduces a new syntax for lambdas via the “fat arrow” syntax:

this.numbers.forEach((n) => this.doSomething(n));

These arrow functions do not only preserve the binding of this but are also shorter. Especially if the function body consists of only a single expression. In this case the curly braces and and the return keyword can be omitted:

// ES 5
numbers.filter(function(n) { return isPrime(n); });
// ES 6
numbers.filter((n) => isPrime(n));

Wide-spread support for ECMAScript 6 is just around the corner, it’s time to familiarize yourself with it if you haven’t done so yet. A nice overview of the new features can be found at es6-features.org.

Getting Shibboleth SSO attributes securely to your application

Accounts and user data are a matter of trust. Single sign-on (SSO) can improve the user experience (UX), convenience and security especially if you are offering several web applications often used by the same user. If you do not want to force your users to big vendors offering SSO like google or facebook or do not trust them you can implement SSO for your offerings with open-source software (OSS) like shibboleth. With shibboleth it may be even feasible to join an existing federation like SWITCH, DFN or InCommon thus enabling logins for thousands of users without creating new accounts and login data.

If you are implementing you SSO with shibboleth you usually have to enable your web applications to deal with shibboleth attributes. Shibboleth attributes are information about the authenticated user provided by the SSO infrastructure, e.g. the apache web server and mod_shib in conjunction with associated identity providers (IDP). In general there are two options for access of these attributes:

  1. HTTP request headers
  2. Request environment variables (not to confuse with system environment variables!)

Using request headers should be avoided as it is less secure and prone to spoofing. Access to the request environment depends on the framework your web application is using.

Shibboleth attributes in Java Servlet-based apps

In Java Servlet-based applications like Grails or Java EE access to the shibboleth attributes is really easy as they are provided as request attributes. So simply calling request.getAttribute("AJP_eppn") will provide you the value of the eppn (“EduPrincipalPersonName”) attribute set by shibboleth if a user is authenticated and the attribute is made available. There are 2 caveats though:

  1. Request attributes are prefixed by default with AJP_ if you are using mod_proxy_ajp to connect apache with your servlet container.
  2. Shibboleth attributes are not contained in request.getAttributeNames()! You have to directly access them knowing their name.

Shibboleth attributes in WSGI-based apps

If you are using a WSGI-compatible python web framework for your application you can get the shibboleth attributes from the wsgi.environ dictionary that is part of the request. In CherryPy for example you can use the following code to obtain the eppn:

eppn = cherrypy.request.wsgi_environ['eppn']

I did not find the name of the WSGI environment dictionary clearly documented in my efforts to make shibboleth work with my CherryPy application but after that everything was a bliss.

Conclusion

Accessing shibboleth attributes in a safe manner is straightforward in web environments like Java servlets and Python WSGI applications. Nevertheless, you have to know the above aspects regarding naming and visibility or you will be puzzled by the behaviour of the shibboleth service provider.

Updating from Grails 2.3 to something newer

We are developing, running and maintaining moderately sized Grails web application with > 120 domain classes  since 2008 or Grails 1.0.3. The web application is still in production running on Grails 2.3.8. Just recently we wanted Java 8 support and the usual bugfixes and improvements you get by updating the framework. Since time and budget are very limited (as always…) we decided not to move to 3.x but only to the latest 2.x version. It seemed a safer and easier option and opened up the way to 3.x where many things changed completely.

Trying to go to 2.5.4

The upgrade procedure is generally well documented in Grails. That allowed us to upgrade from 1.0 to 1.3, from 1.3 to 2.2 and finally from 2.2 to 2.3. We skipped 2.0 because of too many problems we faced during the upgrade. As usual the major changes and tasks are mentioned in the upgrade guide. It started smoothly but we finally had to abort the upgrade process because we were bitten by https://github.com/grails/grails-data-mapping/issues/581 . We had not the time to dig fully into it and resolve the issue.

Trying to go to 2.4.5

Many of the changes and improvements and most notably a Groovy version supporting the Java 8 runtime are already available in Grails 2.4.5. So we gave it a shot hoping for fewer problems than with 2.5.4. Actually we got our application running in less than an hour but quite some of our unit, integration and functional tests failed. After finding some advice in http://stackoverflow.com/questions/16532631/grails-unit-test-mock-domain-with-assigned-id we changed our unit tests to use the @Mock() mixin instead of mockDomain() which works in 2.3 and is broken in 2.4.

When trying to fix our integration tests we saw that some of our HQL queries failed. Something was wrong navigating/querying multiple association levels so we finally gave up on this one, too.

Conclusion

Even though we managed to keep our Grails application alive for many years and several framework versions each upgrade carries a significant risk of breakage and requires quite some effort. This time we are stuck again and will have to invest more time to bring the application up-to-date again.

I would advise anyone already using or deciding for Grails as the web framework of choice to start with the latest and greatest release and to budget several person days for upgrades of medium sized projects. The devil is in the details…

The JavaScript ‘console’ Object

Most JavaScript developers are familiar with these basic functions of the console object: console.log(), .info(), .warn() and .error(). These functions dump a string or an object to the JavaScript console.

However, the console object has a lot more to offer. I’ll demonstrate a selection of the additional functionality, which is less known, but can be useful for development and debugging.

Tabular data

Arrays with tabular structure can be displayed with the console.table() function:

var timeseries = [
 {timestamp: new Date('2016-04-01T00:00:00Z'), value: 42, checked: true},
 {timestamp: new Date('2016-04-01T00:15:00Z'), value: 43, checked: true},
 {timestamp: new Date('2016-04-01T00:30:00Z'), value: 43, checked: true},
 {timestamp: new Date('2016-04-01T00:45:00Z'), value: 41, checked: false},
 {timestamp: new Date('2016-04-01T01:00:00Z'), value: 40, checked: false},
 {timestamp: new Date('2016-04-01T01:15:00Z'), value: 39, checked: false}
];

console.table(timeseries);

The browser will render the data in a table view:

Output of console.table()
JavaScript console table output

This function does not only work with arrays of objects, but also with arrays of arrays.

Benchmarking

Sometimes you want to benchmark certain sections of your code. You could write your own function using new Date().getTime(), but the functions console.time() and console.timeEnd() are already there:

console.time('calculation');
// code to benchmark
console.timeEnd('calculation');

The string parameter is a label to identify the benchmark. The JavaScript console output will look like this:

calculation: 21.460ms

Invocation count

The function console.count() can count how often a certain point in the code is called. Different counters are identified with string labels:

for (var i = 1; i <= 100; i++) {
  if (i % 15 == 0) {
    console.count("FizzBuzz");
  } else if (i % 3 == 0) {
    console.count("Fizz");
  } else if (i % 5 == 0) {
    console.count("Buzz");
  }
}

Here’s an excerpt of the output:

...
FizzBuzz: 6 (count-demo.js, line 3)
Fizz: 25 (count-demo.js, line 5)
Buzz: 13 (count-demo.js, line 7)
Fizz: 26 (count-demo.js, line 5)
Fizz: 27 (count-demo.js, line 5)
Buzz: 14 (count-demo.js, line 7)

Conclusion

The console object does not only provide basic log output functionality, but also some lesser-known, yet useful debugging helper functions. The Console API reference describes the full feature set of the console object.

Making CherryPy Application WSGI compatible

When choosing a micro web framework evolving it to fit your needs is key. As CherryPy is one of our choices I want to show you how to evolve it in terms of web server. Of course you can use the embedded CherryPy web server in development and for small sites. It is fast enough for many use cases and supports important features like SSL so you may come a long way just using it. There are several reasons to put your CherryPy behind a tried and trusted native web server like Apache or nginx:

  • Consistent production environment using different application servers (e.g. for Java and Python) using a powerful and uniform frontend
  • Many options and possibilites using Apache modules
  • Well known and understood environment for administrators
  • Separation of web-facing http server concerns and your web application
  • Improved performance and security

Making CherryPy a WSGI-compatible

The good news is that CherryPy application objects are already a WSGI-compliant application. So creating a wsgi.py like the following will enable integration with mod_wsgi of Apache:

def application(environ, start_response):
    cherrypy.tree.mount(MyApp(), script_name=None, config=None)
    return cherrypy.tree(environ, start_response)

Integrating with Apache’s mod_wsgi

It is quite easy to integrate a Python WSGI application with apache using mod_wsgi. If the module is present you just need to add some directives telling Apache where to mount the wsgi application defined by your wsgi.py script:

WSGIScriptAlias /my_app /path/to/wsgi.py
# May be required to allow your web app using libraries installed on the system
<Directory /usr/lib/python2.7/site-packages/ >
    Order deny,allow
    Allow from all
    Require all granted
</Directory>

After you have such a setup working properly you can consult the mod_wsgi documentation on how to improve in regards to threading, script reloading etc.

Configuring the WSGI-app

Many web applications need some form of configuration. Your application should not make assumptions on its install location or some directory structure. Generally speaking, an application should never assume that it can use relative path names for accessing the filesystem. Also access to operating system environment variables is dangerous because the application may run in different contexts. But we can specify WSGI-environment variables in the web servers’ configuration. An easy and safe way is to provide the configuration directory and other values using WSGI-environment variables that we can specify in the mod_wsgi configuration:

WSGIScriptAlias /my_app /path/to/wsgi.py
SetEnv configuration_dir /etc/my_shiny_web_app
...

We can access the wsgi-environment in python like so:

def application(environ, start_response):
    configdir = environ['configuration_dir']
    cherrypy.config.update(os.path.join(configdir, 'global.conf'))

    cherrypy.tree.mount(MyApp(), config=os.path.join(configdir, 'my_app.conf'))
    return cherrypy.tree(environ, start_response)

Note: Because your web app can be mounted to other locations than “/” on the the web server your application should not hard-code absolute links and the like. They all will be dead if your app is mounted at a different location.

Small is beautiful – CherryPy Microframework

Origami Elephant (Image used with kind permission of Anya Midori)

We are developing web applications for our clients using various different frameworks and technologies. The choice depends on several different factors like hosting, the clients IT infrastructure and administration and of course project scope. Some of our successful web projects use the Grails or Ruby on Rails with JRuby full stack frameworks. While they provide a ton of powerful features they also intrinsically carry some complexity. This is not always needed nor wanted, some projects might fare well with much less. Sometimes the scope of a project is not entirely clear so choosing a lean alternative you can gradually extend and refine may be the right fit.


Full stack frameworks

A full stack framework usually delivers built-in solutions for persistence/database access, domain modelling, routing, html-templating and so on. If you know for sure that you will need all the provided features from the start and that they are a good fit feel free to choose a full stack framework like Rails, Grails, Play or Django. If you need less or there is no convincing solution for your needs start with a minimal system that delivers value to your clients.

Microframeworks

Microframeworks provide only the basic functionality for routing and handling requests. No templating, no databases, no session management etc. attached. We made really good experiences with microframeworks like Nancy for .NET or CherryPy for Python. You start very simple and are up an running in minutes. If most of your GUI is client-side you do not need templating and you do not have it from the start. You do not need a database, well, you do not have one. Your server side logic revolves around REST, there you go!

The key point is that you are not stuck with this minimal set of support but you can easily extend the framework with features if need be. And usually you have several options per concern to choose from. For templating in Python there are many different solutions like Mako, Jinja2Genshi and others. Need only file-based persistence, want to manage your database in SQL or need an object-relational mapper (ORM) – everything is up to you.

CherryPy

Our experience with CherryPy was very positive. It is easy to run standalone using the integrated web server. You can also run it behind any WSGI-compatible web server because a CherryPy application automatically serves as a WSGI application. This is very nice if you need the power of a native web server and the ease and flexibility of a Python microframework. CherryPy is also very flexible when it comes to request routing offering much convenience with the default routing and method annotations to expose actions on the one hand and _cp_dispatch or MethodDispatcher on the other. It feels easy to extend the solution bit by bit as needed, there is seldom something in your way. Configuration is easy and powerful and the documentation gets you up to speed most of the time.

Conclusion

Microframeworks let you choose what you need and which implementation best fits your needs. You do not carry all that complexity with you from the start and easily pull more framework support in as you go choosing the most appropriate for your current situation. Your choices may differ in the next project since every project is different.

The web is for documents

The web is intended to help a person find and understand relevant information. The primary container of information is the document. Therefore web applications should be centered around a document metaphor, not an app one.

The web is intended to help a person find and understand relevant information. The primary container of information is the document. Therefore web applications should be centered around a document metaphor, not an app one.

In 1990 Tim Berners-Lee and Robert Cailliau wrote a proposal for what we call the web today:

HyperText is a way to link and access information of various kinds as a web of nodes in which the user can browse at will.

The web is a linked information system. Bret Victor states:

Information software serves the human urge to learn. A person uses information software to construct and manipulate a model that is internal to the mind — a mental representation of information.

The web is built around information. More information than we can handle. What we need to make sense of it all is understanding. The power of technology can be used to transfer and gain understanding. Understanding needs to be a first class citizen. The applications we build must be centered around it.

One way to foster understanding is to interact, to play with information. Technology can simulate a system of information so that we can form hypotheses and ask questions. Bret Victor coined the term “explorable explanations” to describe such systems.

I believe the web is perfectly suited for building explorable explanations.

The web’s container for information is the document. A document combines different forms of media (text, images, video, …) to a whole. Fortunately for us the web does not stop here. With scripting we have the possibility to interact and manipulate the information in order to gain further insight.

Most of the tools we need to create for understanding are already at our hands. What we need is a fundamental change in focus. Right now (a large part of) the web industry tries to play catch up with native. Whole frameworks try to mimic native applications like this is a virtue. Current developments want to abstract the document as far away as possible. This is not what the web was intended for. Why build an application which tries so hard to recreate a native feeling in something other than the native platform itself? Web applications should be built on the strength of the web. We should not chase a foreign metaphor.
Right now the web seems to be torn. Torn between the print era of passive documents and the shiny new world of native applications. But the web has the capability to do so much more. To concentrate on its purpose, to fill the niche. A massive niche. Understanding is a core endeavor of mankind. To quote Stephen Anderson and Karl Fast in introducing their upcoming book From Information to Understanding:

In all areas of life, we are surrounded by understanding problems.

Doug Engelbart shares a similar vision for the purpose of the personal computer per se:

By “augmenting human intellect” we mean increasing the capability of a man to approach a complex problem situation, to gain comprehension to suit his particular needs, and to derive solutions to problems.

The web is ready. The tools are ready. But are we?

Where to start: foundations

Web, your users deserve better

The web has come a long way since its inception. But nevertheless many applications fail to serve the user appropriately. We talk a lot about new presentation styles, approaches and enhancements. These are all good endeavors but we should not neglect the basics.

The web has come a long way since its inception. But nevertheless many applications fail to serve the user appropriately. We talk a lot about new presentation styles, approaches and enhancements. These are all good endeavors but we should not neglect the basics. Say you have crafted a beautiful application. It is fast, reliable and has all features the client, user or product manager has envisioned. But is it usable? Is its design up to the task? How should you know? You are no designer. But you can evaluate if your application has the fundamental building blocks, the basics. How?
Fortunately there is an ISO standard about the proper behaviour of information systems: ISO 9241-110. It defines seven principles for dialogues (in a wider sense):

  • Suitability for the task: the dialogue is suitable for a task when it supports the user in the effective and efficient completion of the task.
  • Self-descriptiveness: the dialogue is self-descriptive when each dialogue step is immediately comprehensible through feedback from the system or is explained to the user on request.
  • Controllability: the dialogue is controllable when the user is able to initiate and control the direction and pace of the interaction until the point at which the goal has been met.
  • Conformity with user expectations: the dialogue conforms with user expectations when it is consistent and corresponds to the user characteristics, such as task knowledge, education, experience, and to commonly accepted conventions.
  • Error tolerance: the dialogue is error tolerant if despite evident errors in input, the intended result may be achieved with either no or minimal action by the user.
  • Suitability for individualization: the dialogue is capable of individualization when the interface software can be modified to suit the task needs, individual preferences, and skills of the user.
  • Suitability for learning: the dialogue is suitable for learning when it supports and guides the user in learning to use the system.

This sounds pretty abstract so let’s take a look at each principle in detail.

Suitability for the task

bloated app

Simple and easy. You all know the bloated applications from the desktop with myriads of functions, operations, options, settings, preferences, … These are easy to spot. But often the details are left behind. Many applications try to collect too much information. Or in the wrong order. Scattered over too many dialogues. This is such a big problem in today’s information systems that there’s even a German word for preventing this: Datensparsamkeit. Your application should only collect and ask for the information it needs to fulfill its tasks.
But not only collecting information is a problem. Help in little things like placing the focus on the first input field or prefilling fields with meaningful values which can be automatically derived improve the efficience of task completion. Todays application has many context information available and can help the user in filling out these data from the context she is in like the current date, location, selected contexts in the application or previous values.
Above all you have to talk to your users and understand them to adequately support their goals. Communication is key. This is hard work. They might not know what is important to them. Then watch them using your application, look at how they reached their goals before your application was there. What were their problems? What went well? What (common) mistakes did they make? How can your application avoid those?

Self descriptiveness

In every part of your application the user needs to know what is the function of every item on the screen. A recent trend in design generates widgets on the screen that are too ambiguous. Is this a link, a button or just text? What is clickable? Or editable? UX calls this an affordance:

“a situation where an object’s sensory characteristics intuitively imply its functionality and use”

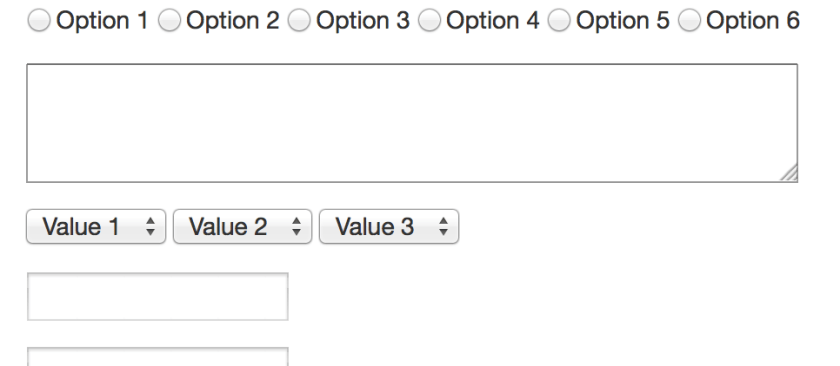
So just from looking at it the user has to have an idea what the control is for. So when you look at the following input field, what is the format of the date you need to enter?

date format

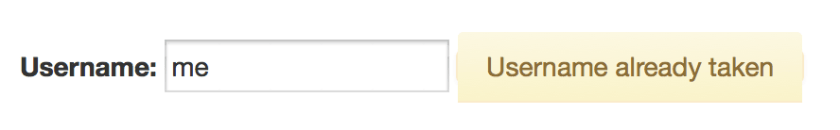
So if your application accepts a set of formats you should tell the user beforehand. Same with required fields or constraints like maximum or minimum length or value ranges. But nowadays applications can go a step further: you can tell the user while she enters her data that her input contradicts another input or value in your database. You can tell her that the username she wants is already taken, the date of the appointment is already blocked.

username taken

Controllability

Everybody has seen this dreaded message:

Item was deleted

Despite any complex confirmations needed to delete an item items get deleted accidentally. What now? Adding levels of confirmation or complex rituals to delete an item does not value the users and their time. Some applications only mark an item as deleted and remove this flag if necessary. That is not enough. What if the user does not delete but overwrites a value of an item by mistake? Your application needs an undo mechanism. A global one. Users as all humans make mistakes. The technology is ready to and should not make them feel bad about it. It can be forgiving. So every action an user does must be revocable. Long running processes must be cancelable. Updates must be undoable.
I know there are exceptions to this. Actions which cause processes in the real world to start can sometimes be irrevocable. Sometimes. Nobody thought that sending an email can be undone. Google did it. How? They delay sending and offer an option to cancel this process. Think about it. Maybe you can undone the actions taken.
Your application should not only allow to reverse a process but also to start a process and complete it. This sounds obvious. But many applications set so many obstacles to find how to start an action. Show the actions which can be started. Provide shortcuts to the user to start and to advance. If your process has multiple steps make it easy for the user to return to where she left.

Conformity with user expectations

Especially in web design where there is so much freedom how your application looks: avoid fancy- or cleverness.

fancyness - blog post without borders and title

There are certain standards how widgets look, stick to them. If the users clicks a button on a form she expects that the content she entered is submitted. If she wants to upload a file the button should be labelled accordingly. Use clear words. Not only conventions determine how something is worded but also the task at hand. If the user expects to see a chart of her data, “calculate” or “generate” might not be the right button label even if the application does that. So again: talk to your users, understand them and their experience. Choose clarity over cleverness. Make it obvious. Your application might look “boring” but if the user knows where and what to do this is some much more worth.

Error tolerance

Oh! Your application accepts scientific notation. Entering 9e999999999… and

boom!

Users don’t enter malicious data by purpose (at least not always). But mistakes happen. Your application should plan for that. Constrain your input values. Don’t blow up when the users attachs a 100 GB file. Tell them what values you accept and when and why their entered information does not comply. Help them by showing fuzzy matches if their search term doesn’t yield an exact match. Even if the user submitted data is correct, data from other sources might not be. Your application needs to be robust. Take into account the problem and error cases not just the sunshine state.

Suitability for individualisation

Users are different. They have differ in skills, education, knowledge, experience and other characteristics. Some might need visual assistance like a color blind mode. Your application needs to provide this. Due to the different levels of experience and the different approachs a user takes your application should provide options to define how much and how the presented information is shown. Take a look at the following table of values. Do you see what is shown?

sinus curve values

Now take a look at a graph with the same values.

sinus curve values as graph

Sometimes one representation is better as another. Again talk to your users they might prefer different presentations.

Suitability for learning

You know your application. You know where to start an action and where to click. You know how the search is used and what filters are. You know where to find the report generation. You built it. But for first time users it is as entering a foreign city. Some things might be familiar and some strange. You need to think about the entry of your application. Users need help. Think about the blank slate, when your user or your application does not have any data. How do you guide the user to create her first project or enter information for the first item. She needs help with where to find the appropiate buttons and links to start the processes. She might not recognize the function behind an icon at first glance. Sometimes a tooltip helps. Sometimes you need a legend. And sometimes you should use a text instead of an icon.

icon glory

Build your own performance and log monitoring solution

Tips for a better performance only help when you know where you can improve performance. So to find the places where speed is needed you can monitor the performance of your app in production. Here we build a simple performance and log monitoring solution.

Tips for a better performance like using views or reducing the complexity of your algorithms only help when you know where you can improve performance. So to find the places where speed is needed you can build extensive load and performance tests or even better you can monitor the performance of your app in production. Many solutions exists which give you varying levels of detail (the costs of them also varies). But often a simple solution is enough. We start with a typical (CRUD) web app and build a monitor and a tool to analyse response times. The goal is to see what are the ten worst performing queries of the last week. We want an answer to this question continuously and maybe ask additional questions like what were the details of the responses like user/role, URL, max/min, views or persistence. A web app built on Rails gives us a lot of measurements we need out of the box but how do we extract this information from the logs?
Typical log entries from an app running on JRuby on Rails 4 using Tomcat looks like this:

Sep 11, 2014 7:05:29 AM org.apache.catalina.core.ApplicationContext log
Information: I, [2014-09-11T07:05:29.455000 #1234]  INFO -- : [19e15e24-a023-4a33-9a60-8474b61c95fb] Started GET "/my-app/" for 127.0.0.1 at 2014-09-11 07:05:29 +0200

...

Sep 11, 2014 7:05:29 AM org.apache.catalina.core.ApplicationContext log
Information: I, [2014-09-11T07:05:29.501000 #1234]  INFO -- : [19e15e24-a023-4a33-9a60-8474b61c95fb] Completed 200 OK in 46ms (Views: 15.0ms | ActiveRecord: 0.0ms)

Important to identify log entries for the same request is the request identifier, in our case 19e15e24-a023-4a33-9a60-8474b61c95fb. To see this in the log you need to add the following line to your config/environments/production.rb:

config.log_tags = [ :uuid ]

Now we could parse the logs manually and store them in a database. That’s what we do but we use some tools from the open source community to help us. Logstash is a tool to collect, parse and store logs and events. It reads the logs via so called inputs, parses, aggregates and filters with the help of filters and stores by outputs. Since logstash is by Elasticsearch – the company – we use elasticsearch – the product – as our database. Elasticsearch is a powerful search and analytcs platform. Think: a REST frontend to Lucene – only much better.

So first we need a way to read in our log files. Logstash stores its config in logstash.conf and reads file with the file input:

input {
  file {
    path => "/path/to/logs/localhost.2014-09-*.log"
    # uncomment these lines if you want to reread the logs
    # start_position => "beginning"
    # sincedb_path => "/dev/null"
    codec => multiline {
      pattern => "^%{MONTH}"
      what => "previous"
      negate => true
    }
  }
}

There are some interesting things to note here. We use wildcards to match the desired input files. If we want to reread one or more of the log files we need to tell logstash to start from the beginning of the file and forget that the file was already read. Logstash remembers the position and the last time the file was read in a sincedb_path to ignore that we just specify /dev/null as a path. Inputs (and outputs) can have codecs. Here we join the lines in the log which do not start with a month. This helps us to record stack traces or multiline log entries as one event.
Add an output to stdout to the config file:

output {
  stdout {
    codec => rubydebug{}
  }
}

Start logstash with

logstash -f logstash.conf --verbose

and you should see your log entries as json output with the line in the field message.
To analyse the events we need to categorise them or tag them for this we use the grep filter:

filter {
  grep {
    add_tag => ["request_started"]
    match => ["message", "Information: .* Started .*"]
    drop => false
  }
}

Grep normally drops all non matching events, so we need to pass drop => false. This filter adds a tag to all events with the message field matching our regexp. We can add filters for matching the completed and error events accordingly:

  grep {
    add_tag => ["request_completed"]
    match => ["message", "Information: .* Completed .*"]
    drop => false
  }
  grep {
    add_tag => ["error"]
    match => ["message", "\:\:Error"]
    drop => false
  }

Now we know which event starts and which ends a request but how do we extract the duration and the request id? For this logstash has a filter named grok. One of the more powerful filters it can extract information and store them into fields via regexps. Furthermore it comes with predefined expressions for common things like timestamps, ip addresses, numbers, log levels and much more. Take a look at the source to see a full list. Since these patterns can be complex there’s a handy little tool with which you can test your patterns called grok debug.
If we want to extract the URL from the started event we could use:

grok {
    match => ["message", ".* \[%{TIMESTAMP_ISO8601:timestamp} \#%{NUMBER:}\].*%{LOGLEVEL:level} .* \[%{UUID:request_id}\] Started %{WORD:method} \"%{URIPATHPARAM:uri}\" for %{IP:} at %{GREEDYDATA:}"]
 }

For the duration of the completed event it looks like:

grok {
    match => ["message", ".* \[%{TIMESTAMP_ISO8601:timestamp} \#%{NUMBER:}\].*%{LOGLEVEL:level} .* \[%{UUID:request_id}\] Completed %{NUMBER:http_code} %{GREEDYDATA:http_code_verbose} in %{NUMBER:duration:float}ms (\((Views: %{NUMBER:duration_views:float}ms \| )?ActiveRecord: %{NUMBER:duration_active_record:float}ms\))?"]
 }

Grok patterns are inside of %{} like %{NUMBER:duration:float} where NUMBER is the name of the pattern, duration is the optional field and float the data type. As of this writing grok only supports floats or integers as data types, everything else is stored as string.
Storing the events in elasticsearch is straightforward replace or add to your stdout output an elasticsearch output:

output {
  elasticsearch {
    protocol => "http"
    host => localhost
    index => myindex
  }
}

Looking at the events you see that start events contain the URL and the completed events the duration. For analysing it would be easier to have them in one place. But the default filters and codecs do not support this. Fortunately it is easy to develop your own custom filter. Since logstash is written in JRuby, all you need to do is write a Ruby class that implements register and filter:

require "logstash/filters/base"
require "logstash/namespace"

class LogStash::Filters::Transport < LogStash::Filters::Base

  # Setting the config_name here is required. This is how you
  # configure this filter from your logstash config.
  #
  # filter {
  #   transport { ... }
  # }
  config_name "transport"
  milestone 1

  def initialize(config = {})
    super
    @threadsafe = false
    @running = Hash.new
  end 

  def register
    # nothing to do
  end

  def filter(event)
    if event["tags"].include? 'request_started'
      @running[event["request_id"]] = event["uri"]
    end
    if event["tags"].include? 'request_completed'
      event["uri"] = @running.delete event["request_id"]
    end
  end
end

We name the class and config name ‘transport’ and declare it as milestone 1 (since it is a new plugin). In the filter method we remember the URL for each request and store it in the completed event. Insert this into a file named transport.rb in logstash/filters and call logstash with the path to the parent of the logstash dir.

logstash --pluginpath . -f logstash.conf --verbose

All our events are now in elasticsearch point your browser to http://localhost:9200/_search?pretty or where your elasticsearch is running and it should return the first few events. You can test some queries like _search?q=tags:request_completed (to see the completed events) or _search?q=duration:[1000 TO *] to get the events with a duration of 1000 ms and more. Now to the questions we want to be answered: what are the worst top ten response times by URL? For this we need to group the events by URL (field uri) and calculate the average duration:

curl -XPOST 'http://localhost:9200/_search?pretty' -d '
{
  "size":0,
  "query": {
    "query_string": {
      "query": "tags:request_completed AND timestamp:[7d/d TO *]"
     }
  },
  "aggs": {
    "group_by_uri": {
      "terms": {
        "field": "uri.raw",
        "min_doc_count": 1,
        "size":10,
        "order": {
          "avg_per_uri": "desc"
        }
      },
      "aggs": {
        "avg_per_uri": {
          "avg": {"field": "duration"}
        }
      }
    }
  }
}'

See that we use uri.raw to get the whole URL. Elasticsearch separates the URL by the /, so grouping by uri would mean grouping by every part of the path. now-7d/d means 7 days ago. All groups of events are included but if we want to limit our aggregation to groups with a minimum size we need to alter min_doc_count. Now we have an answer but it is pretty unreadable. Why not have a website with a list?
Since we don’t need a whole web app we could just use Angular and the elasticsearch JavaScript API to write a small page. This page displays the top ten list and when you click on one it lists all events for the corresponding URL.

<!DOCTYPE html>
<html>
  <head>
    <script type="text/javascript" src="https://ajax.googleapis.com/ajax/libs/angularjs/1.2.11/angular.min.js"></script>
    <script type="text/javascript" src="elasticsearch-js/elasticsearch.angular.js"></script>
    <script type="text/javascript" src="monitoring.js"></script>

    <link rel="stylesheet" href="http://netdna.bootstrapcdn.com/bootstrap/3.1.0/css/bootstrap.min.css">
    <link rel="stylesheet" href="http://netdna.bootstrapcdn.com/bootstrap/3.1.0/css/bootstrap-theme.min.css">
  </head>
  <body>
    <div ng-app="Monitoring" class="container" ng-controller="Monitoring">
      <div class="col-md-6">
        <h2>Last week's top ten slowest requests</h2>
        <table class="table">
          <thead>
            <tr>
              <th>URL</th>
              <th>Average Response Time (ms)</th>
            </tr>
          </thead>
          <tbody>
            <tr ng-repeat="request in top_slow track by $index">
              <td><a href ng-click="details_of(request.key)">{{request.key}}</a></td>
              <td>{{request.avg_per_uri.value}}</td>
            </tr>
          </tbody>
        </table>
      </div>
      <div class="col-md-6">
        <h3>Details</h3>
        <table class="table">
          <thead>
            <tr>
              <th>Logs</th>
            </tr>
          </thead>
          <tbody>
            <tr ng-repeat="line in details track by $index">
              <td>{{line._source.message}}</td>
            </tr>
          </tbody>
        </table>
      </div>
    </div>
  </body>
</html>

And the corresponding Angular app:

var module = angular.module("Monitoring", ['elasticsearch']);

module.service('client', function (esFactory) {
  return esFactory({
    host: 'localhost:9200'
  });
});

module.controller('Monitoring', ['$scope', 'client', function ($scope, client) {
var indexName = 'myindex';
client.search({
index: indexName,
body: {
  "size":0,
  "query": {
    "query_string": {
      "query": "tags:request_completed AND timestamp:[now-1d/d TO *]"
     }
  },
  "aggs": {
    "group_by_uri": {
      "terms": {
        "field": "uri.raw",
        "min_doc_count": 1,
        "size":10,
        "order": {
          "avg_per_uri": "desc"
        }
      },
      "aggs": {
        "avg_per_uri": {
          "avg": {"field": "duration"}
        }
      }
    }
  }
}
}, function(error, response) {
  $scope.top_slow = response.aggregations.group_by_uri.buckets;
});

$scope.details_of = function(url) {
client.search({
index: indexName,
body: {
  "size": 100,
  "sort": [
    { "timestamp": "asc" }
  ],
  "query": {
    "query_string": {
      "query": 'timestamp:[now-1d/d TO *] AND uri:"' + url + '"'
     }
  },
}
}, function(error, response) {
  $scope.details = response.hits.hits;
});
};
}]);

This is just a start. Now we could filter out the errors, combine logs from different sources or write visualisations with d3. At least we see where performance problems lie and take further steps at the right places.