The best way to analyze a crash in an iOS app is if you can reproduce it directly in the iOS simulator in debug mode or on a local device connected to Xcode. Sometimes you have to analyze a crash that happened on a device that you do not have direct access to. Maybe the crash was discovered by a tester who is located in a remote place. In this case the tester must transfer the crash information to the developer and the developer has to import it in Xcode. The iOS and Xcode functionalities for this workflow are a bit hidden, so that the following step-by-step guide can help.
Finding the crash dumps
iOS stores crash dumps for every crash that occured. You can find them in the Settings app in the deeply nested menu hierarchy under Privacy -> Analytics -> Analytics Data.
There you can select the crash dump. If you tap on a crash dump you can see its contents in a JSON format. You can select this text and send it to the developer. Unfortunately there is no “Select all” option, you have to select it manually. It can be quite long because it contains the stack traces of all the threads of the app.
Importing the crash dump in Xcode
To import the crash dump in Xcode you must save it first in a file with the file name extension “.crash”. Then you open the Devices dialog in Xcode via the Window menu:
To import the crash dump you must have at least one device connected to your Mac, otherwise you will find that you can’t proceed to the next step. It can be any iOS device. Select the device to open the device information panel:
Here you find the “View Device Logs” button to open the following Device Logs dialog:
To import the crash dump into this dialog select the “All Logs” tab and drag & drop the “.crash” file into the panel on the left in the dialog.
Initially the stack traces in the crash dump only contain memory addresses as hexadecimal numbers. To resolve these addresses to human readable symbols of the code you have to “re-symbolicate” the log. This functionality is hidden in the context menu of the crash dump:
Now you’re good to go and you should finally be able to find the cause of the crash.
The jenkinscontinuous integration (CI) server provides several ways to trigger builds remotely, for example from a git hook. Things are easy on an open jenkins instance without security enabled. It gets a little more complicated if you like to protect your jenkins build environment.
Git plugin notify commit url
For git there is the “notifyCommitUrl” you can use in combination with the Poll SCM settings:
The url of the source code repository given as a parameter must match the repository url of the jenkins job.
You have to check the Poll SCM setting, but you do not need to provide a schedule
Another drawback is its restriction to git-hosted jobs.
Jenkins remote access api
Then there is the more general and more modern jenkins remote access api, where you may trigger builds regardless of the source code management system you use. curl -X POST $JENKINS_URL/job/$JOB_NAME/build?token=$TOKEN
It allows even triggering parameterized builds with HTTP POST requests like:
Both approaches work great as long as your jenkins instance is not secured and everyone can do everything. Such a setting may be fine in your companies intranet but becomes a no-go in more heterogenious environments or with a public jenkins server.
So the way to go is securing jenkins with user accounts and restricted access. If you do not want to supply username/password as part of the url for doing HTTP BASIC auth and create users just for your repository triggers there is another easy option:
The token root plugin does not need HTTP POST requests but also works fine using HTTP GET. It does neither requires a user account nor the awkward Poll SCM setting. In my opinion it is the most simple and pragmatic choice for build triggering on a secured jenkins instance.
PyCharm is a fantastic tool for python development. One cool feature that I quite like is its support for remote development. We have quite a few projects that need to interact with special hardware, and that hardware is often not attached to the computer we’re developing on.
In order to test your programs, you still need to run it on that computer though, and doing this without tool support can be especially painful. You need to use a tool like scp or rsync to transmit your code to the target machine and then execute it using ssh. This all results in painfully long and error prone iterations.
Fortunately, PyCharm has tool support in its professional edition. After some setup, it allows you do develop just as you would on a local machine. Here’s a small guide on how to set it up with an ubuntu vagrant virtual machine, connecting over ssh. It work just as nicely on remote computers.
1. Create a new deployment configuration
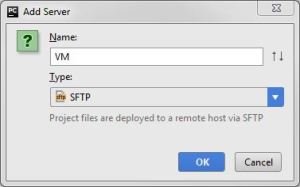
In the Tools->Deployment->Configurations click the small + in the top left corner. Pick a name and choose the SFTP type.
In the “Connection” Tab of the newly created configuration, make sure to uncheck “Visible only for this project”. Then, setup your host and login information. The root path is usually a central location you have access to, like your home folder. You can use the “Autodetect” button to set this up.
For my VM, the settings look like this.
On the “Mappings” Tab, set the deployment path for your project. This would be the specific folder of your project within the root you set on the previous page. Clicking the associated “…” button here helps, and even lets you create the target folder on the remote machine if it does not exist yet.
2. Activate the upload
Now check “Tools->Deployment->Automatic Upload”. This will do an upload when you change a file, so you still need to do the initial upload manually via “Tools->Deployment->Upload to “.
3. Create a project interpreter
Now the files are synced up, but the runtime environment is not on the remote machine. Go to the “Project Interpreter” page in File->Settings and click the little gear in the top-right corner. Select “Add Remote”.
It should have the Deployment configuration you just created already selected. Once you click ok, you’re good to go! You can run and debug your code just like on a local machine.
For many of our projects the Jenkins continuous integration (CI) server is one important cornerstone. The well known “works on my machine” means nothing in our company. Only code in repositories and built, tested and packaged by our CI servers counts. In addition to building, testing, analyzing and packaging our projects we use CI jobs for deployment and supervision, too. In such jobs you often need some sort of credentials like username/password or public/private keys.
If you are using username/password they do not only appear in the job configuration but also in the console build logs. In most cases this is undesirable but luckily there is an easy way around it: using the Environment Injector Plugin.
In the plugin you can “inject passwords to the build as environment variables” for use in your commands and scripts.
The nice thing about this is that the passwords are not only masked in the job configuration (like above) but also in the console logs of the builds!
There is a lot more to explore when it comes to authentication and credential management in Jenkins as you can define credentials at the global level, use public/private key pairs and ssh agents, connect to a LDAP database and much more. Just do not sit back and provide security related stuff plaintext in job configurations or your deployments scripts!
Awk is a little language designed for the processing of lines of text. It is available on every Unix (since V3) or Linux system. The name is an acronym of the names of its creators: Aho, Weinberger and Kernighan.
Since I spent a couple of minutes to learn awk I have found it quite useful during my daily work. It is my favorite tool in the base set of Unix tools due to its simplicity and versatility.
Typical use cases for awk scripts are log file analysis and the processing of character separated value (CSV) formats. Awk allows you to easily filter, transform and aggregate lines of text.
The idea of awk is very simple. An awk script consists of a number of patterns, each associated with a block of code that gets executed for an input line if the pattern matches:
pattern_1 {
# code to execute if pattern matches line
}
pattern_2 {
# code to execute if pattern matches line
}
# ...
pattern_n {
# code to execute if pattern matches line
}
Patterns and blocks
The patterns are usually regular expressions:
/error|warning/ {
# executed for each line, which contains
# the word "error" or "warning"
}
/^Exception/ {
# executed for each line starting
# with "Exception"
}
There are some special patterns, namely the empty pattern, which matches every line …
{
# executed for every line
}
… and the BEGIN and END patterns. Their blocks are executed before and after the processing of the input, respectively:
BEGIN {
# executed before any input is processed,
# often used to initialize variables
}
END {
# executed after all input has been processed,
# often used to output an aggregation of
# collected values or a summary
}
Output and variables
The most common operation within a block is the print statement. The following awk script outputs each line containing the string “error”:
/error/ { print }
This is basically the functionality of the Unix grep command, which is filtering. It gets more interesting with variables. Awk provides a couple of useful built-in variables. Here are some of them:
$0 represents the entire current line
$1 … $n represent the 1…n-th field of the current line
NF holds the number of fields in the current line
NR holds the number of the current line (“record”)
By default awk interprets whitespace sequences (spaces and tabs) as field separators. However, this can be changed by setting the FS variable (“field separator”).
The following script outputs the second field for each line:
{ print $2 }
Input:
John 32 male
Jane 45 female
Richard 73 male
Output:
32
45
73
And this script calculates the sum and the average of the second fields:
{
sum += $2
}
END {
print "sum: " sum ", average: " sum/NR
}
Output:
sum: 150, average: 50
The language
The language that can be used within a block of code is based on C syntax without types and is very similar to JavaScript. All the familiar control structures like if/else, for, while, do and operators like =, ==, >, &&, ||, ++, +=, … are there.
Semicolons at the end of statements are optional, like in JavaScript. Comments start with a #, not with //.
Variables do not have to be declared before usage (no ‘var’ or type). You can simply assign a value to a variable and it comes into existence.
String concatenation does not have an explicit operator like “+”. Strings and variables are concatenated by placing them next to each other:
"Hello " name ", how are you?"
# This is wrong: "Hello" + name + ", how are you?"
print is a statement, not a function. Parentheses around its parameter list are optional.
Functions
Awk provides a small set of built-in functions. Some of them are:
User-defined functions look like JavaScript functions:
function min(number1, number2) {
if (number1 < number2) {
return number1
}
return number2
}
In fact, JavaScript adopted the function keyword from awk. User-defined functions can be placed outside of pattern blocks.
Command-line invocation
An awk script can be either read from a script file with the -f option:
$ awk -f myscript.awk data.txt
… or it can be supplied in-line within single quotes:
$ awk '{sum+=$2} END {print "sum: " sum " avg: " sum/NR}' data.txt
Conclusion
I hope this short introduction helped you add awk to your toolbox if you weren’t familiar with awk yet. Awk is a neat alternative to full-blown scripting languages like Python and Perl for simple text processing tasks.
In former posts I wrote about packaging your software as RPM packages for a variety of use cases. The other big binary packaging system on Linux systems is DEB for Debian, Ubuntu and friends. Both serve the purpose of convenient distribution, installation and update of binary software artifacts. They define their dependencies and describe what the package provides.
How do you provide your software as DEB packages?
The master guide to debian packaging can be found at https://www.debian.org/doc/manuals/maint-guide/. It is a very comprehensive guide spanning many pages and providing loads of information. Building a usable package of your software for your clients can be a matter of minutes if you know what to do. So I want to show you the basic steps, for refinement you will need to consult the guide or other resources specific to the software you want to package. For example there are several guides specific to packaging of software written in Python. I find it hard to determine what the current and recommended way to debian packages for python is because there are differing guides over the last 10 years or so. You may of course say “Just use pip for python” 🙂
Basic tools
The basic tools for building debian packages are debhelper and dh-make. To check the resulting package you will need lintian in addition. You can install them and basic software build tools using:
The python packaging system uses make and several scripts under the hood to help building the binary packages out of source tarballs.
Your first package
First you need a tar-archive of the software you want to package. With python setuptools you could use python setup.py sdist to generate the tarball. Then you run dh_make on it to generate metadata and the package build environment for your package. Now you have to edit the metadata files, namely control, copyright, changelog. Finally you run dpkg-buildpackage to generate the package itself. Here is an example of the necessary commands:
mkdir hello-deb-1.0
cd hello-deb-1.0
dh_make -f ../hello-deb-1.0.tar.gz
# edit deb metadata files
vi debian/control
vi debian/copyright
vi debian/changelog
dpkg-buildpackage -us -uc
lintian -i -I --show-overrides hello-deb_1.0-1_amd64.changes
The control file roughly resembles RPMs SPEC file. Package name, description, version and dependency information belong there. Note that debian is very strict when it comes to naming of packages, so make sure you use the pattern ${name}-${version}.tar.gz for the archive and that it extracts into a corresponding directory without the extension, e.g. ${name}-${version}.
If everything went ok several files were generated in your base directory:
The package itself as .deb file
A file containing the changelog and checksums between package versions and revisions ending with .changes
A file with the package description ending with .dsc
A tarball with the original sources renamed according to debian convention hello-deb_1.0.orig.tar.gz (note the underscore!)
Going from here
Of course there is a lot more to the tooling and workflow when maintaining debian packages. In future posts I will explore additional means for improving and updating your packages like the quilt patch management tool, signing the package, symlinking, scripts for pre- and post-installation and so forth.
Sometimes you have developed a simple utility tool that doesn’t need the directory structure of a full-blown application for resources and other configuration. However, this tool might have a couple of library dependencies. On the .NET platform this usually means that you have to distribute the .dll files for the libraries along with the executable (.exe) file of the tool.
Wouldn’t it be nice to distribute your tool only as a single .exe file, so that users don’t have to drag around a lot of files when they move the tool from one location to another?
In the C++ world you would use static linking to link library dependencies into the resulting executable. For the .NET platform Microsoft provides a command-line tool called ILMerge. It can merge multiple .NET assemblies into a single assembly:
You can either download ILMerge from Microsoft as an .msi package or install it as a NuGet package from the package manager console (accessible in Visual Studio under Tools: Library Package Manager):
PM> Install-Package ilmerge
The basic command line syntax of ILMerge is:
> ilmerge /out:filename <primary assembly> [...]
The primary assembly would be the original executable of your tool. It must be listed first, followed by the library assemblies (.dll files) to merge. Here’s an example, which represents the scenario from the diagram above:
Keep in mind that the resulting executable is still dependent on the existence of the .NET framework on the system, it’s not completely independent.
Graphical user interface
There’s also a graphical user interface for ILMerge available. It’s an open-source tool by a third-party developer and it’s called ILMerge-GUI, published on Microsoft’s CodePlex project hosting platform.
You simply drag and drop the assemblies to merge on the designated area, choose a name for the output assembly and click the “Merge!” button.
Sometimes you want to send (e.g. by e-mail) a set of new Git commits to someone else who has the same repository at an older state, without transferring the whole repository and without sharing a common remote repository.
One feature that might come to your mind are Git patches. Patches, however, don’t work when there are branches and merge commits in the commit history: git format-patch creates patches for the commits across the various branches in the order of their commit times and doesn’t create patches for merge commits.
Git bundles
The solution to the problem are Git bundles. Git bundles contain a partial excerpt of a Git repository in a single file.
This is how to create a bundle, including branches, merge commits and tags:
Using sensors is a task we often face in our company. This article series consisting of two parts will show how to install a GPS module in a Raspberry Pi and to provide access to the GPS data over ethernet. This guide is based on a Raspberry Pi Model B Revision 2 and the GPS shield “Sparqee GPSv1.0”. In the first part, we will demonstrate the setup of the hardware and the retrieval of GPS data within the Raspberry Pi.
Hardware configuration
The GPS shield can be connected to the Raspberry Pi by using the pins in the top left corner of the board.
The Sparqee GPS shield possesses five pins whose purpose can be found on the product page:
Pin
Function
Voltage
I/O
GND
Ground connection
0
I
RX
Receive
2.5-6V
I
TX
Transmit
2.5-6V
O
2.5-6V
Power input
2.5-6V
I
EN
Enable power module
2.5-6V
I
Sparqee GPSv1.0
We used the following pin configuration for connecting the GPS shield:
GPS Shield
Raspberry Pi
Pin-Nummer
GND
GND
9
RX
GPIO14 / UART0 TX
8
TX
GPIO15 / UART0 RX
10
2.5-6V
+3V3 OUT
1
EN
+3V3 OUT
17
You can see the corresponding pin numbers on the Raspberry board in the graphic below. A more detailed guide for the functionality of the different pins can be found here.
Relevant pins of the Raspberry Pi
After attaching the GPS module, our Raspberry Pi looks like this:
Attaching the GPS shield to the Raspberry
GPS data retrieval
The Raspberry GPS communicates with the Sparqee GPS shield over the serial port UART0. However, in Raspbian this port is usually used as serial console, which is why we cannot directly access the GPS shield. To turn this feature off and activate the module, you have to follow these steps:
Edit the file /boot/cmdline.txt and delete all parameters containing the key ttyAMA0:
Finally, we can test the GPS module with Minicom. The baud rate is 9600 and the device name is /dev/ttyAMA0:
sudo minicom -b 9600 -D /dev/ttyAMA0 -o
If necessary, you can install Minicom using APT:
sudo apt-get install minicom
You can quit Minicom with the key combination strg+a followed by z.
If you succeed, Minicom will continually output a stream of GPS data. Depending on wether the GPS module attains a lock, that is, wether it receives GPS data by a satellite, the output changes. While no data is received, the output remains mostly empty.
Once the GPS module starts receiving a signal, Minicom will display more data as in the example below. If you encounter problems in attaining a GPS lock, it might help to place the Raspberry Pi outside.
A detailed description of the GPS format emitted by the Sparqee GPSv1.0 can be found here. Probably the most important information, the GPS coordinates, is contained by the line starting with $GPGGA: In this case, the module was located at 33° 55.3471′ Latitude North and 117° 41.7128′ Longitude West at an altitude of 112.2 meters above mean sea level.
Conclusion
We demonstrated how to connect a Sparqee GPS shield to a Raspberry Pi and how to display the GPS data via Minicom. In the next part, we will write a network service that extracts and delivers the GPS data from the serial port.
In the last article we learned how to create a GStreamer pipeline that streams a test video via an Icecast server to the web. In this article we will use GStreamer’s programmable appsrc element, in order to feed the pipeline with raw image data from our application.
Building the pipeline
First we will recreate the pipeline from the last article in C source code. We use plain C, since the original GStreamer API is a GLib based C API.
In order to compile this code the GStreamer development files must be installed on your system. On an openSUSE Linux system, for example, you have to install the package gstreamer-plugins-base-devel. Compile and run this code from the command line:
The key in this simple program is the gst_parse_launch call. It takes the same pipeline string that we built on the command line in the previous article as an argument and creates a pipeline object. The pipeline is then started by setting its state to playing.
appsrc
So far we have only recreated the same pipeline that we called via gst-launch-1.0 before in C code. Now we will replace the videotestsrc element with an appsrc element:
We assign a name (“imagesrc”) to the appsrc element by setting its name attribute in the pipeline string in line 58. The element can then be retrieved via this name by calling the function gst_bin_get_by_name. In lines 61-66 we set properties and capabilities of the appsrc element such as the image format (in this example 8 bit greyscale), width, height and frames per second.
In lines 71 and 72 we connect callback functions to the “need-data” and “enough-data” signals. The appsrc element emits the need-data signal, when it wants us to feed more image frame buffers to the pipeline and the enough-data signal when it wants us to stop.
We use an idle source to schedule calls to the read_data function in the main loop. The interesting work happens in read_data: we acquire the raw pixel data of the image for the next frame as byte array, in this example represented by a call to a function named get_next_image. The pixel data is wrapped into a GStreamer buffer and the duration and timestamp of the buffer is set. We track the time in a self-defined context object. The buffer is then sent to the appsrc via gst_app_src_push_buffer. GStreamer will take care of freeing the buffer once it’s no longer needed.
Conclusion
With little effort we created a simple C program that streams image frames from within the program itself as video to the Web by leveraging the power of GStreamer and Icecast.