Nginx upload limit

Today, I encountered a surprising issue with my Docker-based web application. The application has an upload limit set, but before reaching it, an unexpected error appeared:

413 Request Entity Too Large

Despite the application’s upload limit being correctly configured, the error occurred much earlier—when the file was barely over 1MB. Where does this limitation come from, and how can it be changed?


Troubleshooting

The issue occurred before the request even reached the application layer, during a critical step in request processing. The root cause was Nginx, the web server and reverse proxy used in the Docker stack.

Nginx, commonly used in modern application stacks for load balancing, caching, and HTTPS handling, acts as the gateway to the application, managing all incoming requests. However, Nginx was rejecting uploads larger than 1MB. This was due to the client_max_body_size directive, which—when unset—defaults to a relatively low limit in some configurations. As a result, Nginx blocked larger file uploads before they could reach the application.

Solution

To resolve this issue, the client_max_body_size directive in the Nginx configuration needed to be updated to allow larger file uploads.

Modify the nginx.conf file or the relevant server block configuration:

server {
    listen 80;
    server_name example.com;
    client_max_body_size 100M;  # Allow uploads up to 100MB
}

After making this change, restart Nginx to apply the new configuration:

nginx -s reload

If Nginx is running in a Docker container, you can restart the container instead:

docker restart <container_name>

With this update, the upload limit increased to 100MB, allowing the application to handle larger files without premature rejection. Once the configuration was applied, the error disappeared, and file uploads worked as expected, provided they remained within the newly defined limits.

Useful browser features for the common Web Dev

Once every while, I stumble upon some minor thing ingrained in modern browsers that make some specific problem so much easier. And while the usual Developer Tools offer tons of capabilities, these are so wildly spread and grouped that you easily get used to just ignoring most of them.

So this bunch of things come to my mind that seem not to be super-common knowledge. Maybe you benefit from some of it.

Disclaimer: The browsers I know of have their Dev Tools available via pressing F12 and a somewhat similar layout, even though particular words will differ. My naming here relates to the current Chrome, so your experience might differ.

Disabling the Browser cache

Your Browser caches many resources because the standard user usually prefers speed, is used that the browser endlessly hogs memory anyway, and most resources usually do not change that often anyway.

During development, this might lead to confusion because of course, you do change your sources often (in fact, that is your job), and the browser needs to know that fact.

For that, let it be known:

The "Network Tab" has a Checkbox "Disable Cache".
And the Dev Tools have to be open for it to work.

This is usually so much the default setting on my working machines that I need to remember myself on it when I troubleshoot something on someone else’s machine. Spread the word.

Also, browsers have a Hard-Reload-Feature, like under Chrome, to cleaning the Cache before the reload without having to do so for the whole browser.

Hard-Reload: Ctrl + Shift + R

I’ve read that this is also Chrome’s behaviour when pressing F5 while the Dev Tools are open, but anyway. Take extra care that your customer does not of that feature, because sometimes they might be frustrated about a failed update of your app that is actually just a cached version.

Inspect Network Requests

Depending on the complexity of your web app, or what external dependencies you are importing, it might be that the particular order and content of network requests is not trivial anymore.

Now the “Network” tab (you know it already) is interesting on its own, but remember that it only displays the requests since opening the Dev Tools, i.e. some Page Reload (hard or soft) might be required.

And – this appears somewhat changing between browser updates, don’t ask me why that is necessary – this is good to know:

  • The first column of that list shows only the last part of each request URL, but if you click on it, a very helpful window appears with details of the Request Headers, Payload and Response
  • make sure that in the filters above, the “Fetch/XHR” is active
  • And then some day I found, that
Right-Clicking a request gives you options for Copy, e.g. Copy as fetch, to so you can repeat the exact request from javascript-code for debugging etc.

Inspecting volatile elements

The “Elements” tab (called “Inspector” in other browsers) is quite straightforward to find mistakes in styling or the rendered HTML itself – you see the whole current HTML structure, click your element in there and to the right, from bottom to top you see the CSS rules applied.

But sometimes, it can be hard to inspect elements that change on mouse interaction, and it is good to know that (again, this holds for Chrome), first,

There is a shortcut like Ctrl + Shift + C to get into the Inspector without extra mouse movements

Now think of a popup that vanishes when hovering away. You might do it by using Ctrl + Shift + C to open the Inspector, then using the Keyboard to navigate within (especially with the Tab and Cursor keys), but here’s a small trick I thought of that helped me a lot:

Add (temporarily) an on-click-handler to your popup that calls window.alert(...);

With that, you can open your popup, press Ctrl + Shift + C, then click the popup, and the alert() will now block any events and you can use your mouse to inspect all you want.

In easer cases you could just disable the code that makes the popup go away, but in that case I had, this wasn’t an option either.

Now that I think of it, I could also have used debugger; instead of the alert(), but the point is that you have to block javascript execution only after interacting with the popup element.

The performance API

I have no idea why I discovered that only recently, but if precision in timing is important – e.g. measuring the impact of a possible change on performance, one does not have to resort to Date.now() with its millisecond resolution, but

there is performance.now() to give you microsecond precision for time measurements.

It can afford that by not having the epoch “zero” of Jan 1th 1970 as reference, and instead, the moment of starting your page.

The Performance API has a lot more stuff – which I didn’t need yet.

A FPS Monitor, and a whole world of hidden features

If you do graphics programming or live data visualization of some measurement, it might be of interest to see that. There’s a whole hidden menu at least in Chrome, and you can access it by focussing the Dev Tools, then

  • press Ctrl + Shift + P
  • Enter “FPS” and select
  • Now you have a nice overlay over your page.

Even if you are not in the target group of that specific feature, it might be interesting to know that there is a whole menu of many particular (sometimes experimental) features built into all these browsers. They differ from browser to browser, and version to version, and of course, plugins can do a lot more,

but it might just be worth the idea to think that maybe your work flow can benefit from any of that stuff.

Exploring Dynamic SQL in Oracle: Counting Specific Values Across Multiple Tables

Imagine you have a large database where multiple tables contain a column named BOOK_ID. Perhaps you’re tasked with finding how many times a particular book (say, with an ID of 12345) appears across all these tables. How would you approach this?

In this post, I’ll explain a small piece of Oracle PL/SQL code that uses dynamic SQL to search for a specific value in any table that has a column with a specific name.

Finding the relevant tables

First, we need to determine which tables in the schema have a column with the desired name. To do this, we must look at a metadata table or view that contains information about all the tables in the schema and their columns. Most database systems offer such metadata tables, although their names and their structures vary greatly between different systems. In Oracle, the metadata table relevant to our task is called DBA_TAB_COLUMNS. Therefore, to find the names of all tables that contain a column BOOK_ID, you can use the following query:

SELECT table_name 
  FROM dba_tab_columns 
  WHERE column_name = 'BOOK_ID';

The output might be:

TABLE_NAME
-----------------
BOOKS
LIBRARY_BOOKS
ARCHIVED_BOOKS
TEMP_BOOKS
OLD_BOOKS

Looping through the tables

Now we want to loop through these tables in order to execute an SQL query for each of them. In Oracle we use a PL/SQL FOR loop to do this:

BEGIN
  FOR rec IN (SELECT table_name 
              FROM dba_tab_columns 
              WHERE column_name = 'BOOK_ID')
  LOOP
    -- do something for each record
  END LOOP;
END;
/

Dynamic SQL Construction

We can use the loop variable rec to dynamically create an SQL statement as a string by using the string concatenation operator || and assign it to a variable, in this case v_sql:

v_sql := 'SELECT COUNT(BOOK_ID) FROM ' || rec.table_name || ' WHERE BOOK_ID = :val';

The :val part is a placeholder that will become relevant later.

Of course, the variable needs to be declared for the PL/SQL code block first, so we add a DECLARE section:

DECLARE
  v_sql VARCHAR2(4000);
BEGIN
  -- ...
END;

How do we execute the SQL statement that we stored in the variable? By using the EXECUTE IMMEDIATE statement and two other variables; let’s call them v_result and v_value:

EXECUTE IMMEDIATE v_sql INTO v_result USING v_value;

This will execute the SQL in v_sql, replace the :val placeholder by the value in v_value, and store the result in v_result. The latter will capture the result of our dynamic query, which is the count of occurrences.

Of course, we have to declare these two variables as well. We’ll set v_value to the book ID we are looking for. The whole code so far is:

DECLARE
  v_sql VARCHAR2(4000);
  v_value NUMBER := 12345;  -- Value to search for
  v_result VARCHAR2(4000);
BEGIN
  FOR rec IN (SELECT table_name 
              FROM dba_tab_columns 
              WHERE column_name = 'BOOK_ID')
  LOOP
    v_sql := 'SELECT COUNT(BOOK_ID) FROM ' || rec.table_name || ' WHERE BOOK_ID = :val';

    EXECUTE IMMEDIATE v_sql INTO v_result USING v_value;
  END LOOP;
END;
/

Printing the results

If we execute the code above, we might be a little disappointed because it is accepted and executed without any errors, but nothing is printed out. How can we see the results? For that, we need to include DBMS_OUTPUT.PUT_LINE calls:

DBMS_OUTPUT.PUT_LINE('Found in ' || rec.table_name || ': ' || v_result);

But how do we handle the cases if no record was found or if there was an error in the SQL query? We’ll wrap it in an EXCEPTION handling block:

BEGIN
  EXECUTE IMMEDIATE v_sql INTO v_result USING v_value;
  DBMS_OUTPUT.PUT_LINE('Found in ' || rec.table_name || ': ' || v_result);
EXCEPTION
  WHEN NO_DATA_FOUND THEN
    NULL;  -- No matching rows found in this table
  WHEN OTHERS THEN
    DBMS_OUTPUT.PUT_LINE('Error in ' || rec.table_name || ': ' || SQLERRM);
END;

There’s still one thing to do. We first have to enable server output to see any of the printed lines:

SET SERVEROUTPUT ON;

This command ensures that any output generated by DBMS_OUTPUT.PUT_LINE will be displayed in your SQL*Plus or SQL Developer session.

Let’s put it all together. Here’s the full code:

SET SERVEROUTPUT ON;

DECLARE
  v_sql VARCHAR2(4000);
  v_value NUMBER := 12345;  -- Value to search for
  v_result VARCHAR2(4000);
BEGIN
  FOR rec IN (SELECT table_name 
              FROM dba_tab_columns 
              WHERE column_name = 'BOOK_ID')
  LOOP
    v_sql := 'SELECT COUNT(BOOK_ID) FROM ' || rec.table_name || ' WHERE BOOK_ID = :val';

    BEGIN
      EXECUTE IMMEDIATE v_sql INTO v_result USING v_value;
      DBMS_OUTPUT.PUT_LINE('Found in ' || rec.table_name || ': ' || v_result);
    EXCEPTION
      WHEN NO_DATA_FOUND THEN
        NULL; -- No rows found in this table
      WHEN OTHERS THEN
        DBMS_OUTPUT.PUT_LINE('Error in ' || rec.table_name || ': ' || SQLERRM);
    END;
  END LOOP;
END;
/

Here’s what the output might look like when the block is executed:

Found in BOOKS: 5
Found in LIBRARY_BOOKS: 2
Found in ARCHIVED_BOOKS: 0

Alternatively, if one of the tables throws an error (for instance, due to a permissions issue or if the table doesn’t exist in the current schema), you might see an output like this:

Found in BOOKS: 5
Error in TEMP_BOOKS: ORA-00942: table or view does not exist
Found in LIBRARY_BOOKS: 2

Conclusion

Dynamic SQL is particularly useful when the structure of your query is not known until runtime. In this case, since the table names come from a data dictionary view (dba_tab_columns), the query must be constructed dynamically.

Instead of writing a separate query for each table, the above code automatically finds and processes every table with a BOOK_ID column. It works on any table with the right column, making it useful for large databases.

Building and running SQL statements on the fly allows you to handle tasks that are not possible with static SQL alone.

Local Javascript module development

https://www.viget.com/articles/how-to-use-local-unpublished-node-packages-as-project-dependencies/

yalc: no version upgrade, no publish etc.

Building an application using libraries – called packages or modules in Javascript – is a common practice since decades. We often use third-party libraries in our projects to not have to implement everything ourselves.

In this post I want to describe the less common situation where we are using a library we developed on our own and/or are actively maintaining. While working on the consuming application we need to change the library sometimes, too. This can lead to a cumbersome process:

  1. Need to implement a feature or fix in the application leads to changes in our library package.
  2. Make a release of the library and publish it.
  3. Make our application reference the new version of our library.
  4. Test everything and find out, that more changes are needed.
  5. Goto 1.

This roundtrip-cycle takes time, creates probably useless releases of our library and makes our development iterations visible to the public.

A faster and lighter alternative

Many may point to npm link or yarn link but there are numerous problems associated with these solutions, so I tried the tool yalc.

After installing the tool (globally) you can make changes to the library and publish them locally using yalc publish.

In the dependent project you add the local dependency using yalc add <dependency_name>. Now we can quickly iterate without creating public releases of our library and test everything locally until we are truly ready.

This approach worked nicely for me. yalc has a lot more features and there are nice guides and of course its documentation.

Conclusion

Developing several javascript modules locally in parallel is relatively easy provided the right tooling.

Do you have similar experiences? Do you use other tools you would recommend?

You are mislead about the Big-O notation

One statement I have people say and people repeat a lot, especially in the data-oriented design bubble, is that Big-O notation cannot accurately real-life performance of contemporary computer programs, especially in the presence of multi-tier memory hierarchies like L1/L2/L3-caches for RAM. This is, at best, misleading and gives this fantastic tool a bad reputation.

At it’s core, Big-O is just a way to categorize functions in how they scale. There’s nothing in the formal definition about performance at all. Of course, it is often used to categorize performance of algorithms and implementations of them. But to use it for that, you need two other things: A machine model and a metric for it.

Traditionally, when performance categorization using Big-O is taught, the machine model is either the Turing-machine or the slightly closer-to-reality RAM-machine. The metric is a number of operations. The operation that is counted has a huge impact. For example, insertion sort can easily be implemented in O(n*log(n)) when counting the number of comparisons (by using binary search to find the insertion point), but is in O(n²) when counting the number of memory moves/swaps.

Neither the model nor the metric is intrinsic to Big-O. To use in in the context of memory hierarchies, you just need to start counting what matters to you, e.g. memory accesses, cache misses or branch mispredictions. This is not new either, I learned about cache-aware and cache-oblivious machine models for this in university over 15 years ago.

TL;DR: Big-O is not obsolete, you just have to use it to count the appropriate performance-critical element in your algorithm.

Integrating API Key Authorization in Micronaut’s OpenAPI Documentation

In a Java Micronaut application, endpoints are often secured using @Secured(SecurityRule.IS_AUTHENTICATED), along with an authentication provider. In this case, authentication takes place using API keys, and the authentication provider validates them. If you also provide Swagger documentation for users to test API functionalities quickly, you need a way for users to specify an API key in Swagger that is automatically included in the request headers.

For a general guide on setting up a Micronaut application with OpenAPI Swagger and Swagger UI, refer to this article.

The following article focuses on how to integrate API key authentication into Swagger so that users can authenticate and test secured endpoints directly within the Swagger UI.

Accessing Swagger Without Authentication

To ensure that Swagger is always accessible without authentication, update the application.yml file with the following settings:

micronaut:  
  security:
    intercept-url-map:
      - pattern: /swagger/**
        access:
          - isAnonymous()
      - pattern: /swagger-ui/**
        access:
          - isAnonymous()
    enabled: true

These settings ensure that Swagger remains accessible without requiring authentication while keeping API security enabled.

Defining the Security Schema

Micronaut supports various Swagger annotations to configure OpenAPI security. To enable API key authentication, use the @SecurityScheme annotation:

import io.swagger.v3.oas.annotations.security.SecurityScheme;
import io.swagger.v3.oas.annotations.enums.SecuritySchemeIn;
import io.swagger.v3.oas.annotations.enums.SecuritySchemeType;

@SecurityScheme(
    name = "MyApiKey",
    type = SecuritySchemeType.APIKEY,
    in = SecuritySchemeIn.HEADER,
    paramName = "Authorization",
    description = "API Key authentication"
)

This defines an API key security scheme with the following properties:

  • Name: MyApiKey
  • Type: APIKEY
  • Location: Header (Authorization field)
  • Description: Explains how the API key authentication works

Applying the Security Scheme to OpenAPI

Next, we configure Swagger to use this authentication scheme by adding it to @OpenAPIDefinition:

import io.swagger.v3.oas.annotations.info.*;
import io.swagger.v3.oas.annotations.security.SecurityRequirement;

@OpenAPIDefinition(
    info = @Info(
        title = "API",
        version = "1.0.0",
        description = "This is a well-documented API"
    ),
    security = @SecurityRequirement(name = "MyApiKey")
)

This ensures that the Swagger UI recognizes and applies the defined authentication method.

Conclusion

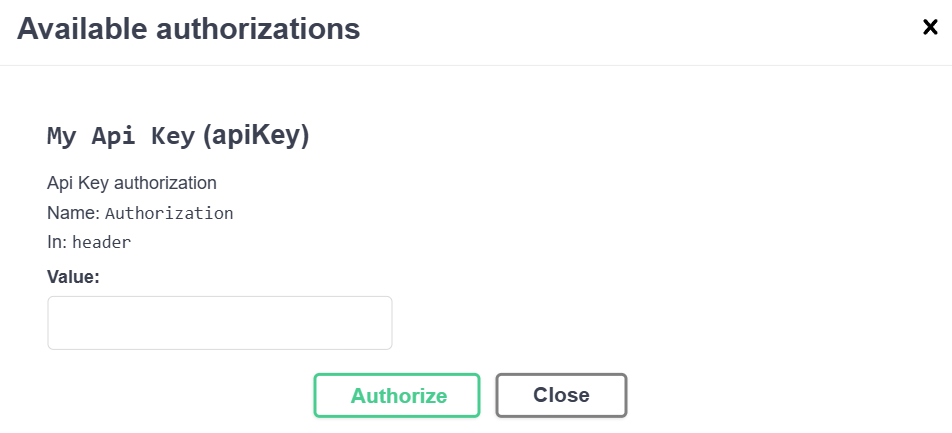
With these settings, your Swagger UI will display an Authorization field in the top-left corner.

Users can enter an API key, which will be automatically included in all API requests as a header.

This is just one way to implement authentication. The @SecurityScheme annotation also supports more advanced authentication flows like OAuth2, allowing seamless token-based authentication through a token provider.

By setting up API key authentication correctly, you enhance both the security and usability of your API documentation.

How React components can know their actual dimensions

Every once in a while, styling a Web Application can be oh so frustrating quite interesting because stuff that appears easy does actually not comply with any of your suggestions. And there are some fields that ambush me more often than I’d like to admit, and with each application there appears some unique quirk that makes a universal solution hard.

Right now, I’m thinking about a CSS-only nested layout of several areas on your available screen that need to make good use of the available space, but still be somewhat dynamic in order to be maintainable.

Web Apps are especially delicate in layout things because if you ask most customers, a fully responsive layout is never the goal (as in, way too expensive for their use case), but no matter how often you make them assure you that there is only a small set of target resolutions, there will be one day where something changed and well-yeah-these-ones-too-of-course.

It is also commonly encountered that “looking good” is “not that important”, but as progress goes, everyone still knows that that was a pure lie.

Of course, this is a manifestation of Feature Creep, but one that is hard to argue about. And we do not want to argue with customers anyway, we want to solve their problems with as little friction as possible.

So by now, one would have thought that CSS would have evolved quite enough in order to at least place dynamic content somewhat predictable. There are flexbox and grid displays and these are useful as hell, but still.

And while, for some reason or another, the width of dynamic nested content can usually be accounted for in some pure CSS solution that one can find in under a day’s work; getting the height quite right is a problem that is officially harder than all multi-order corrections I ever encountered in my studies of quantum field theory. Only solvable in some oversimplified use-cases.

The limits of “height: 100%;” are reached in cases where content is dominated by its content instead of their container; as in nested <svg> elements that love to disagree about the meaning of “100%”. Dynamic SVG content is especially more cumbersome because you neither want distorted nor cut-off content, and you can try to get along with viewBox and preserveAspectRatio, but even then.

Maybe it won’t budge, and maybe that’s the point where I find it acceptable to read the actual DOM elements even from within a React component, an approach that is usually as dangerous as it is intrusive,

but is it a code smell if it is rather concise and reliantly does the job?

const useHeightAwareRef = () => {
    const [height, setHeight] = useState({
        initialized: false,
        value: null,
    });
    const ref = useRef(null);

    useEffect(() => {
        if (!ref.current || height.initialized) {
            return;
        }

        const adjustHeight = () => {
            const rect = ref.current?.getBoundingClientRect();
            setHeight({
                value: rect?.height ?? null,
                initialized: true
            });
        };

        adjustHeight();
        window.addEventListener("resize", adjustHeight);
        return () => {
            window.removeEventListener("resize", adjustHeight);
        };
    }, [height.initialized]);

    return {
        height: height.initialized ? height.value : null,
        ref
    };
};

// then use this like:

const SomeNestedContent = () => {
    const {height, ref} = useHeightAwareRef();

    return (
        <div ref={ref}>
        {
            height &&
            <svg height={height} width={"100%"}>
                { /* ... Dragons be here ... */ }
            </svg>
        }
        </div>
    );
};

I find this worthfile to have in your toolbox. If you manage your super-dynamic* content in some other super-responsive** fashion in a way that is super-arguable*** to your customer, sure, go by it. But remember, at some point each, possibly,

  • (*) your customer might have data outside the mutually agreed use cases,
  • (**) your customer might have screens outside the mutually agreed ones,
  • (***) your customer might have less patience / time than originally intended,

so maybe move the idea of “there must be one super-elegant pure-CSS solution in the year of 2025” back into your dreams and shoehorn that <svg> & friends into where they belong :´)

Beware of using Git LFS on Github

In my private game programming projects, I am often using data files alongside my code for all kinds of game assets like images and sounds. So I thought it might be a good idea to use the Git Large File Storage (=LFS) extension for that.

What is Git LFS?

Essentially, if you’re not using it, the file will be in your local .git folder if it was part of your repository at any time in your history. E.g. if you accidentally added&committed a 800mb video files and then deleted it again, they will still be in your local .git folder. This problem multiplies when using a CI with many branches: each branch will typically have a copy of all files ever used in your repository. This is not a problem with source code files, because they are not that big and they can be compressed really well with different versions of themselves, which is what git typically does.

With Git LFS, the big files are only stored as references in the .git folder. This means that you might need an additional request to your remote when checking them out again, but it will save you lots space and traffic when cloning repositories.

In my previous projects on github, I just did not enable LFS for my assets. And that worked fine, as my assets are usually pretty small and I don’t change them often. But this time I wanted to try it.

Sorry, Github, what?

Imagine my suprise when I got an e-mail from github last month warning me that my LFS traffic quota is almost reached and I have to pay to extend it. What? I never had and traffic quota problems without LFS. Github doesn’t even seem to have one, if I just keep my big files in ‘pure’ git. So that’s what I get for trying to safe Github traffic.

Now the LFS quota is a meager 1 gb per month with Github Pro. That’s nothing. Luckily, my current project is not asset heavy: the full repo is very small at ~60mb. But still the quota was reached with me as a single developer. How did that happen? I just enabled CI for my project on my home server and I was creating lots of branches my CI wanted to build. That’s only 12 branches cloned for the 80% warning to be reached.

Workarounds

Jenkins, which I’m using as a CI tool, has the ability to use a ‘reference repository’ when cloning. This can be used to get the bulk of the data from a local remote, while getting the rest from Github. This is what I’m now using to avoid excess LFS traffic. It is a bit of a pain to set up: you have to manually maintain this reference repository, Jenkins will not do it for you, and you have to do that on each agent. I only have one at this point, so that’s an okay trade-off. But next time, Isure won’t use Git LFS on Github, if I can avoid it.

Inline and Implicit Foreign Key Constraints in SQL

Foreign key constraints are a key part of database design, ensuring that relationships between tables are consistent and reliable. They create a relationship between two tables, ensuring that data matches across them. For example, a column in an “Orders” table (like CustomerID) might reference a column in a “Customers” table. This guarantees that every order belongs to a valid customer.

In earlier versions of SQL systems, defining foreign key constraints often required separate ALTER TABLE statements after the table was created:

CREATE TABLE Orders (
  OrderID    INT PRIMARY KEY,
  CustomerID INT NOT NULL,
  OrderDate  DATE
);

ALTER TABLE Orders
ADD CONSTRAINT FK_Customer FOREIGN KEY (CustomerID)
REFERENCES Customers(CustomerID);

This two-step process was prone to errors and required careful management to ensure all constraints were applied correctly.

Inline Foreign Key Constraints

Most of the popular SQL database systems – PostgreSQL, Oracle, SQL Server, and MySQL since version 9.0, released in July 2024 – now support inline foreign key constraints. This means you can define the relationship directly in the column definition, making table creation easier to read:

CREATE TABLE Orders (
  OrderID    INT PRIMARY KEY,
  CustomerID INT NOT NULL REFERENCES Customers(CustomerID),
  OrderDate  DATE
);

Fortunately, this syntax is the same across these systems. However, MySQL 9 additionally supports implicit foreign key constraints:

CREATE TABLE Orders (
  OrderID    INT PRIMARY KEY,
  CustomerID INT NOT NULL REFERENCES Customers,
  OrderDate  DATE
);

By leaving out the (CustomerID) in the REFERENCES clause it will assume that you want to reference the primary key of the parent table. This syntax is unique to MySQL, and you should avoid it if you need to write SQL DDL statements that works across multiple database systems.

No more Schneide Dev Brunches

In the year 2004, we had an idea: What if we met on Sunday for a late breakfast or early lunch (hence the word “brunch”) and talked about software, software development and IT in general while we ate?

The “brunch” theme pinpointed the time: 11 o’clock. The presence of food implied the presence of a dining table, something we found in our company kitchen (and later directly besides it). This defined the place: The kitchen of the Softwareschneiderei became the location to meet, eat and talk every other month, six times a year.

The brunches had no real structure or guest list, we showed up and were open to contributions, ideas and nearly everything that happened, as long as it fitted the shared interest of the participants.

For 20 years, we continued this series of events. It was great fun, real inspiration and always a source for thoughts and new ideas. Because it was designed as a meeting in presence, we had some challenges over the years:

First, the list of regular guests grew until the demand for some kind of transcript of meetings that were missed added the habit of “recap blog entries”. You can still find them, they have their own category on our blog:

https://schneide.blog/category/events/dev-brunch/

The recap was dropped when we shared more details about topics on the mailing list that acted as a planning tool for the meetings.

Second, in early 2020, we were faced with the reality that in-person meetings wouldn’t be feasible for quite some time. We didn’t have a crystal ball that could predict the future of the corona pandemic, so we couldn’t be sure, but we had some knowledge about the 1918 influenza pandemic from the book “Pale Rider”, written by Laura Spinney that some of us read in 2018. We took it as a prediction of the things that might come and switched to online meetings, which changed the character of the brunch, not least because nobody ate on camera anymore. The beginning of the pandemic was an eventful period for us, as we not only changed the Dev Brunch, but also everything else in our daily work.

A third thing became obvious when it would have been feasible to meet in person again: Everybody lives somewhere else now. We would have a stark drop in attendance if we went back to in-person brunches, just because of basic geography. We considered hybrid events, but they might have been the “worst of both worlds” instead of a good compromise.

The fourth thing that is about to change is the discontinuation of our mailing list infrastructure. This might sound like a small thing, but we take privacy and data protection really seriously and don’t want to move e-mail addresses around without proper consent by everybody. If we build up a new equivalent to the mailing list, we will start from scratch with proper agreements. Again, this might sound over the top in comparison to other companies’ conduct in regard to e-mail addresses, but that’s no reason to act the same.

So, this is farewell to a series of events that helped shape us the way we are. The Dev Brunch was a wonderful idea that facilitated our passion: software development. That doesn’t mean we are less passionate or less inclined to talk for hours about software development. It just means that the setting of future talks will be different.

Let us stay in touch!